From baseline bottlenecks to pilot results

A warehouse improvement case and a showcase of the shared slide system.
Part I
Setting the frame and objectives
Today’s Flow
Decision Needed
Approve an 8-week rollout across Zones A-C
Key assumptions
By the end of this presentation, you will be able to:
Travel time drives 62% of total pick cycle time.
What if we could ship 14,000 more orders per week without adding headcount?
FulfillCo Logistics - West Hub
Director of Operations Analytics
FulfillCo Logistics
What I do
Why listen
Contact
Operations
Finance and Customer Experience

FulfillCo Optimize 2026
Program goals
Part II
Layouts, purpose, and high-impact patterns
West Hub ships ~24k orders/day across three zones. Current performance shows:
Constraint
62% of cycle time is travel + search, not picking.
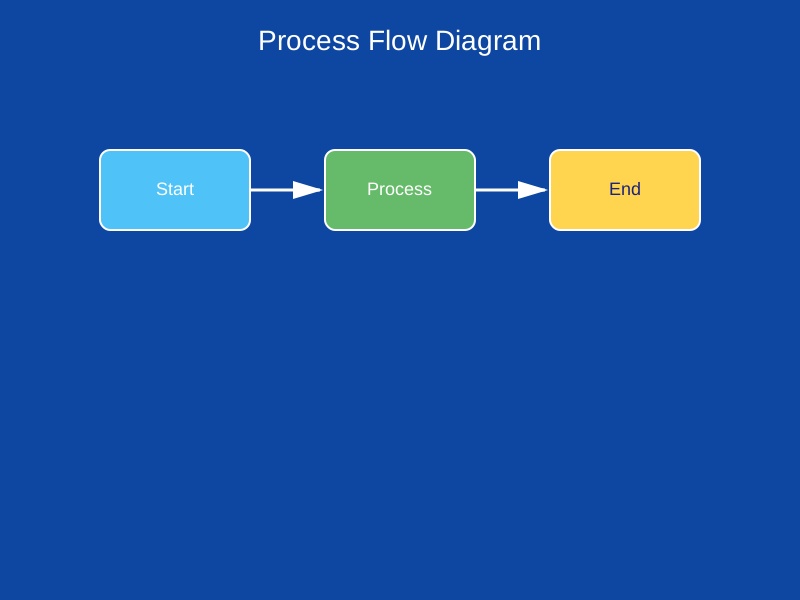
See Figure 1 for the typical pick flow diagram.
Root causes observed
These issues create congestion and extra walking (see Figure 1)
Slotting
Move fast movers closer to pack
Top movers: A/B/C runners
Batching
Group orders by aisle affinity
Wave size: 12-16 orders
Pathing
Dynamic routes reduce cross-aisle trips
Rule: one-way aisles during peak
23%
Reduction in average pick cycle time after pilot
Measured across Zones A-C over 6 weeks
Small changes in travel paths create big gains in throughput.
- Priya Nair, VP Operations, FulfillCo
This is why we focused on travel distance before adding labor.
Every extra step is a tax on throughput, accuracy, and morale.
See Figure 2 for the pilot delivery roadmap.
See Figure 3 for the effort vs impact decision matrix.
Part III
Figures, tables, and diagrams that teach
| Metric | Baseline | Target | Pilot |
|---|---|---|---|
| Orders per hour | 420 | 520 | 515 |
| Pick cycle time (min) | 6.8 | 5.2 | 5.2 |
| Mis-pick rate | 1.9% | 0.8% | 0.7% |
| Travel per shift (km) | 7.4 | 5.5 | 5.6 |
Readout
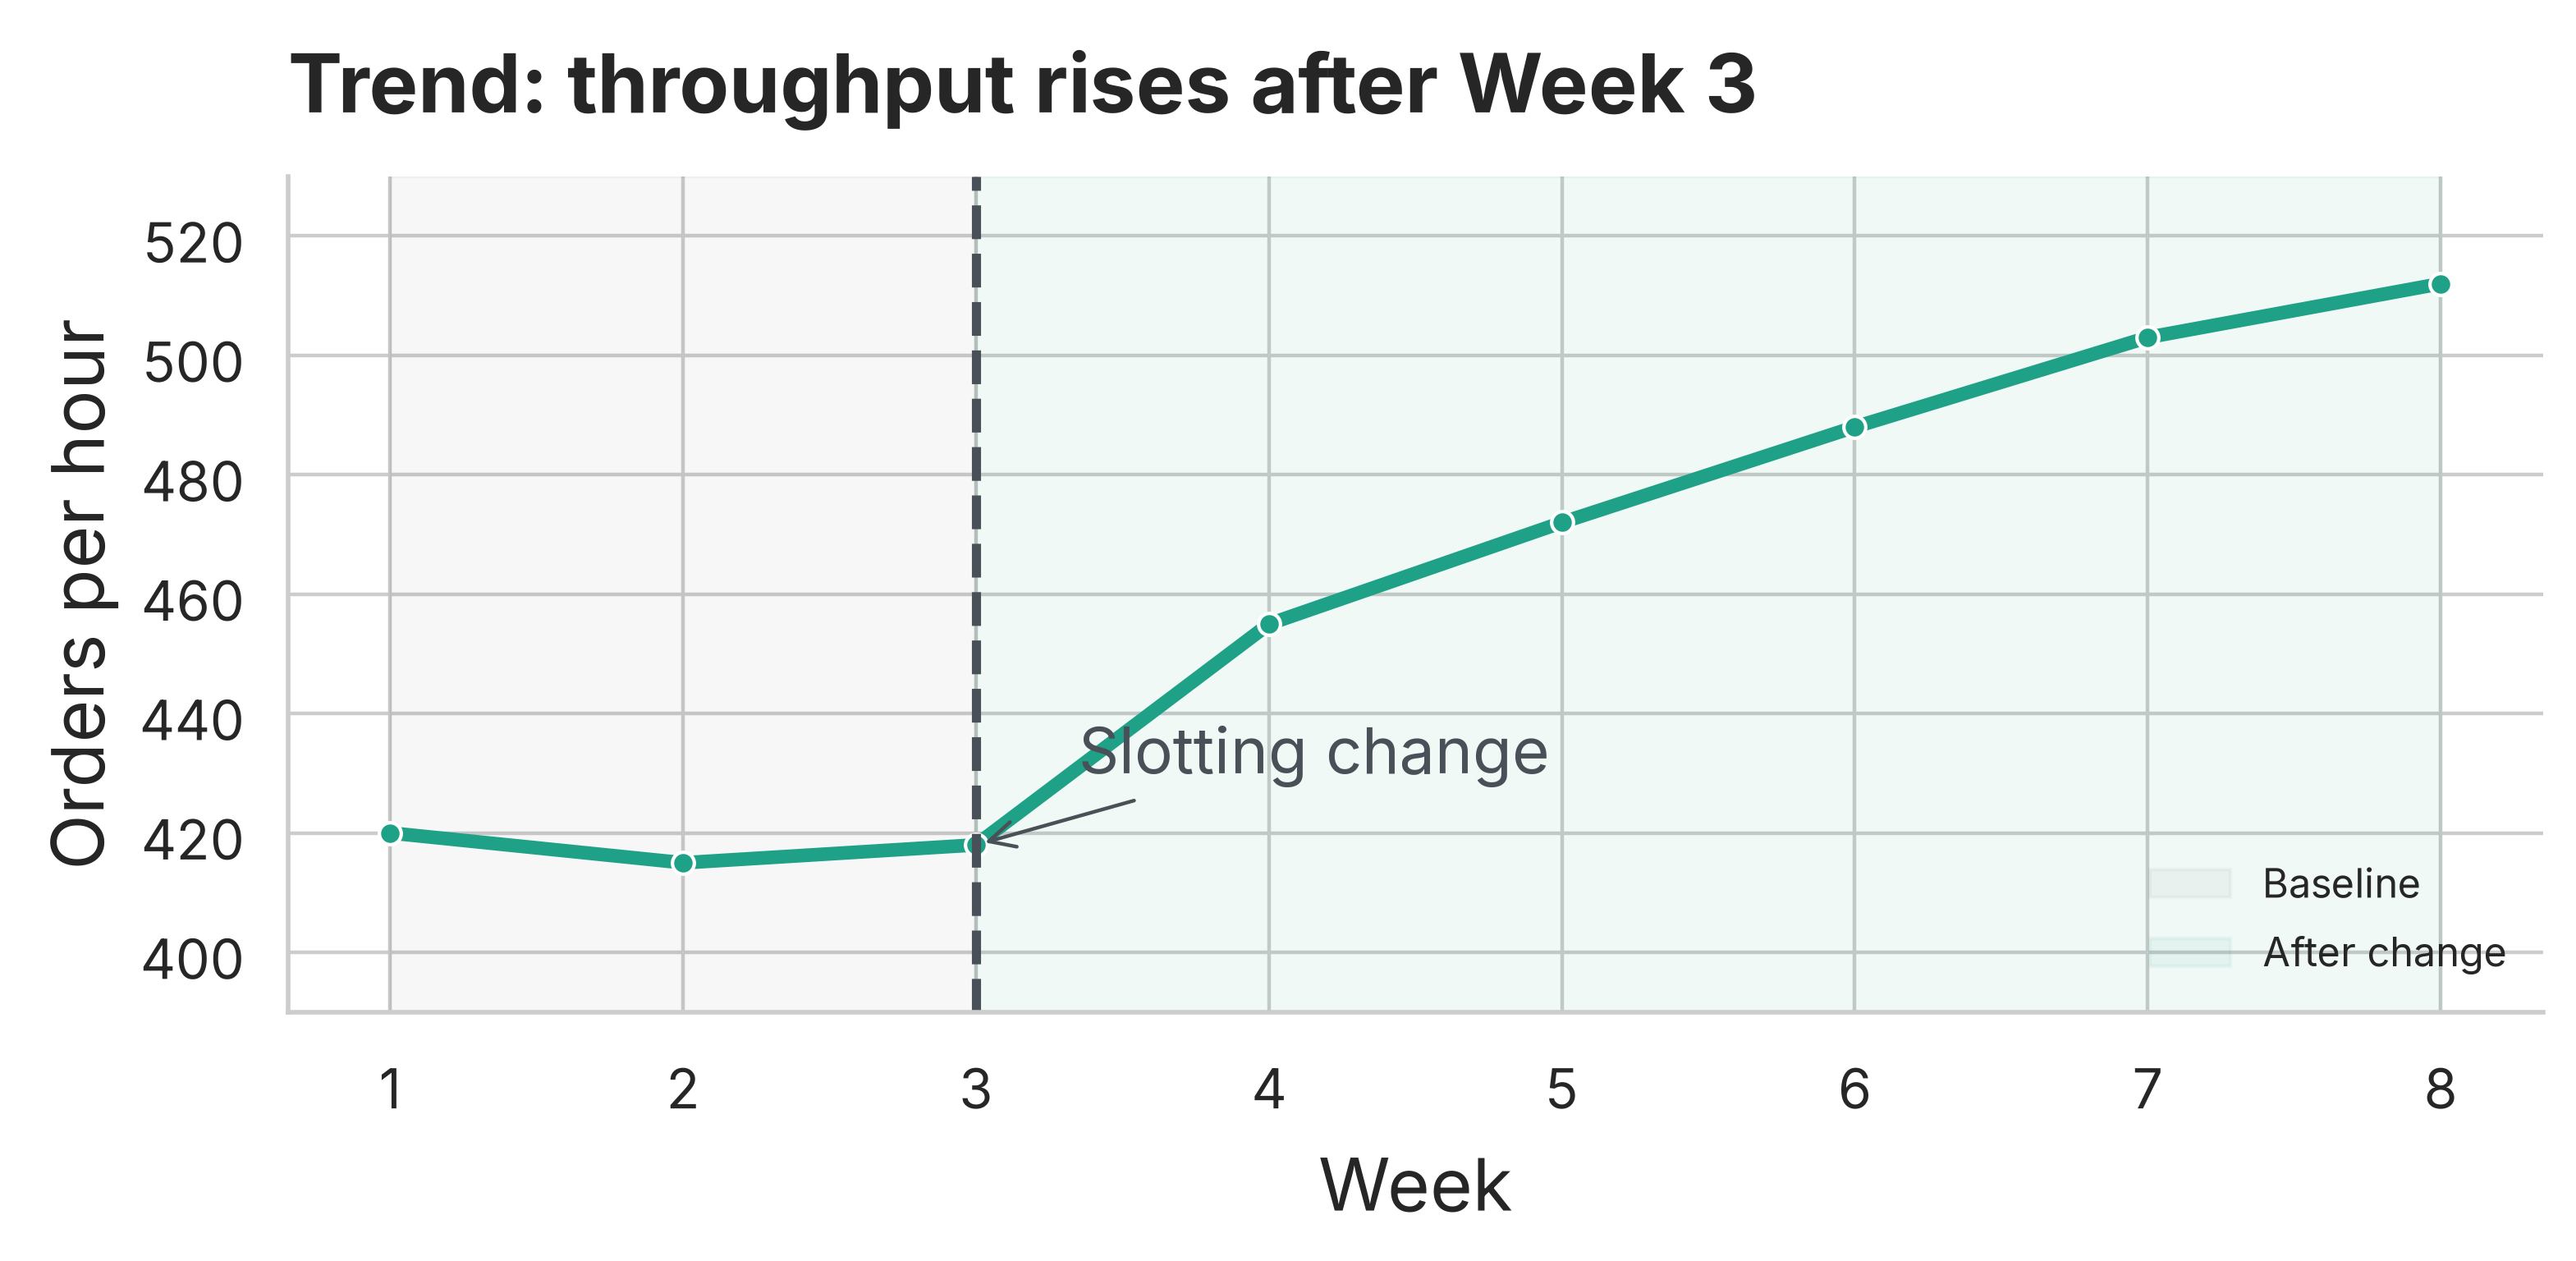
Throughput increased steadily after slotting changes in Week 3.
Hot spots cluster near Aisle 7 and the cross-dock lane.

Part IV
Readable code, reproducible results
# Build initial tour
current = 0
route = [current]
visited = {current}
while len(visited) < len(orders):
next_stop = min(
(i for i in range(len(orders)) if i not in visited),
key=lambda i: travel_time[current, i]
)
route.append(next_stop)
visited.add(next_stop)
current = next_stop
# Improve with 2-opt
route = two_opt(route, travel_time)When to use
Tip
Syntax: add code-line-numbers="|1|3-6|8" to a code block.
def two_opt(route, dist):
improved = True
while improved:
improved = False
for i in range(1, len(route) - 2):
for j in range(i + 2, len(route) - 1):
delta = (
dist[route[i-1], route[j]]
+ dist[route[i], route[j+1]]
- dist[route[i-1], route[i]]
- dist[route[j], route[j+1]]
)
if delta < -1e-10:
route[i:j+1] = reversed(route[i:j+1])
improved = True
break
if improved:
break
return route# Step 1: Build an initial route (fast, not optimal)
current = 0
route = [current]
visited = {current}
while len(visited) < len(orders):
next_stop = min(
(i for i in range(len(orders)) if i not in visited),
key=lambda i: travel_time[current, i]
)
route.append(next_stop)
visited.add(next_stop)
current = next_stop# Step 1: Build an initial route (fast, not optimal)
current = 0
route = [current]
visited = {current}
while len(visited) < len(orders):
next_stop = min(
(i for i in range(len(orders)) if i not in visited),
key=lambda i: travel_time[current, i]
)
route.append(next_stop)
visited.add(next_stop)
current = next_stop
# Step 2: Improve it (small effort, big travel-time gain)
route = two_opt(route, travel_time)def two_opt(route, dist):
improved = True
best = route
while improved:
improved = False
for i in range(1, len(best) - 2):
for j in range(i + 2, len(best) - 1):
delta = (
dist[best[i-1], best[j]] + dist[best[i], best[j+1]] -
dist[best[i-1], best[i]] - dist[best[j], best[j+1]]
)
if delta < -1e-10:
best[i:j+1] = reversed(best[i:j+1])
improved = True
break
if improved:
break
return bestLive Demo
Run a 50-order batch, show route overlay, then export KPIs.
The pick cycle time can be expressed as:
\[ T = T_{travel} + T_{search} + T_{pick} + T_{scan} \]
Where \(T_{travel}\) dominates during peak congestion.
Part V
Active learning and guided practice
Question: Which action reduces travel time the most?
A. Add two scanners per aisle
B. Re-slot top 300 SKUs to fast aisles
C. Add one extra picker per shift
D. Increase pack station count
Activity (10 minutes)
In teams of 3, map your zone’s top 20 SKUs to A/B/C slots.
Deliverable
Timebox
Risk: Aisle Congestion
Replenishments overlap with pick waves between 9-11 AM.
Best Lever: Re-slot Top 300 SKUs
Moves 41% of volume into 2 fast aisles.
Critical: Scanner Latency
2-3s delays add ~18 minutes per shift.
Mistake: Mixing A/B/C in one aisle
Creates cross-traffic and breaks batching logic.
Mistake: Untrained temps in fast aisles
Quality drops before cycle time improves.
Mistake: Ignoring replenishment windows
Re-slotting can backfire without timing controls.
Part VI
Breaks, Q&A, and audience flow
Parking Lot
Questions we will return to later:
Live demo: running the heuristic and visualizing the tour
Plan
python run_pilot.py --zone A15:00
Please return by 10:45 AM
Email: breno@fulfillco.com
Ops Wiki: ops.fulfillco.com/west-hub
Part VII
Synthesis and next steps
Approve Rollout
Proceed with an 8-week rollout across Zones A-C, starting March 1.
Owner: Ops Excellence
Budget: $180k
Success metrics: -20% cycle time, >99% accuracy
Breno A. Beirigo
Slides created with Quarto and reveal.js
Part VIII
Video, imagery, and social proof
“The new slotting rules cut training time in half. New hires hit target pace by day 10.”
- Maria Lopez, West Hub Operations Lead
Pilot KPIs
Training ramp: 4 weeks -> 2 weeks : 98.1% -> 99.3%
Signals of adoption
Why include social proof?
Quote
“Pilot results changed how we schedule labor.”
Sarah Johnson, DC Manager
West Hub - 2w
The slotting changes reduced congestion immediately. Pickers report less backtracking and faster training.
Like 127 - Comment 23 - Share 45
Peak hour footage
Pick density increased while congestion decreased.
Floor-level still
Throughput
Travel heatmap

Floor context
“Orders ship earlier now, and we see fewer partials at the docks.”
- Regional Carrier Partner
Appendix
Risks, rollout plan, and operating model
| Risk | Impact | Likelihood | Mitigation |
|---|---|---|---|
| Poor data quality | High | Medium | Data audit + validation checks |
| Overfitting to benchmarks | Medium | Medium | Holdout instances + ablations |
| Low adoption | High | Low | Pilot, training, human-in-the-loop |
See Figure 4 for the implementation plan diagram.
Optimization is not the goal.
Better decisions are the goal.
Optimization creates decision leverage: faster planning, fewer errors, and more consistent outcomes.
Part IX
Step-by-step method walkthrough
The method comprises 5 steps:
We solve a routing problem with constraints:
Feasible Solution
Meets capacity, time windows, and route length limits.
Common moves:
Instead of recomputing the full tour cost, use a delta evaluation:
\[ \Delta = (c_{a,c} + c_{b,d}) - (c_{a,b} + c_{c,d}) \]
Stop when:
Practical default
Always enforce a hard time limit for reproducibility and fairness.
Part X
Reusable layout building blocks
West Hub
Why this site?
We chose West Hub because changes here generalize to other sites.
Baseline
Baseline
Interventions
Interventions
Pilot
Improvement
Rollout
Deployment
People
Roles and ownership
Process
Routines and SOPs
Data
Inputs and quality
Model
Optimization logic
Tech
Tooling and uptime
Change
Training and adoption
Standardization unlocks scale.
Once West Hub is stable, we can replicate the playbook across 7 sites.
Part XI
Common questions → charts that answer them
Use the question to pick the chart. Most stakeholder asks fit one of these:
Design Rules of Thumb
Readout
The slope and the step-change matter more than week-to-week noise — annotate the intervention.
Readout
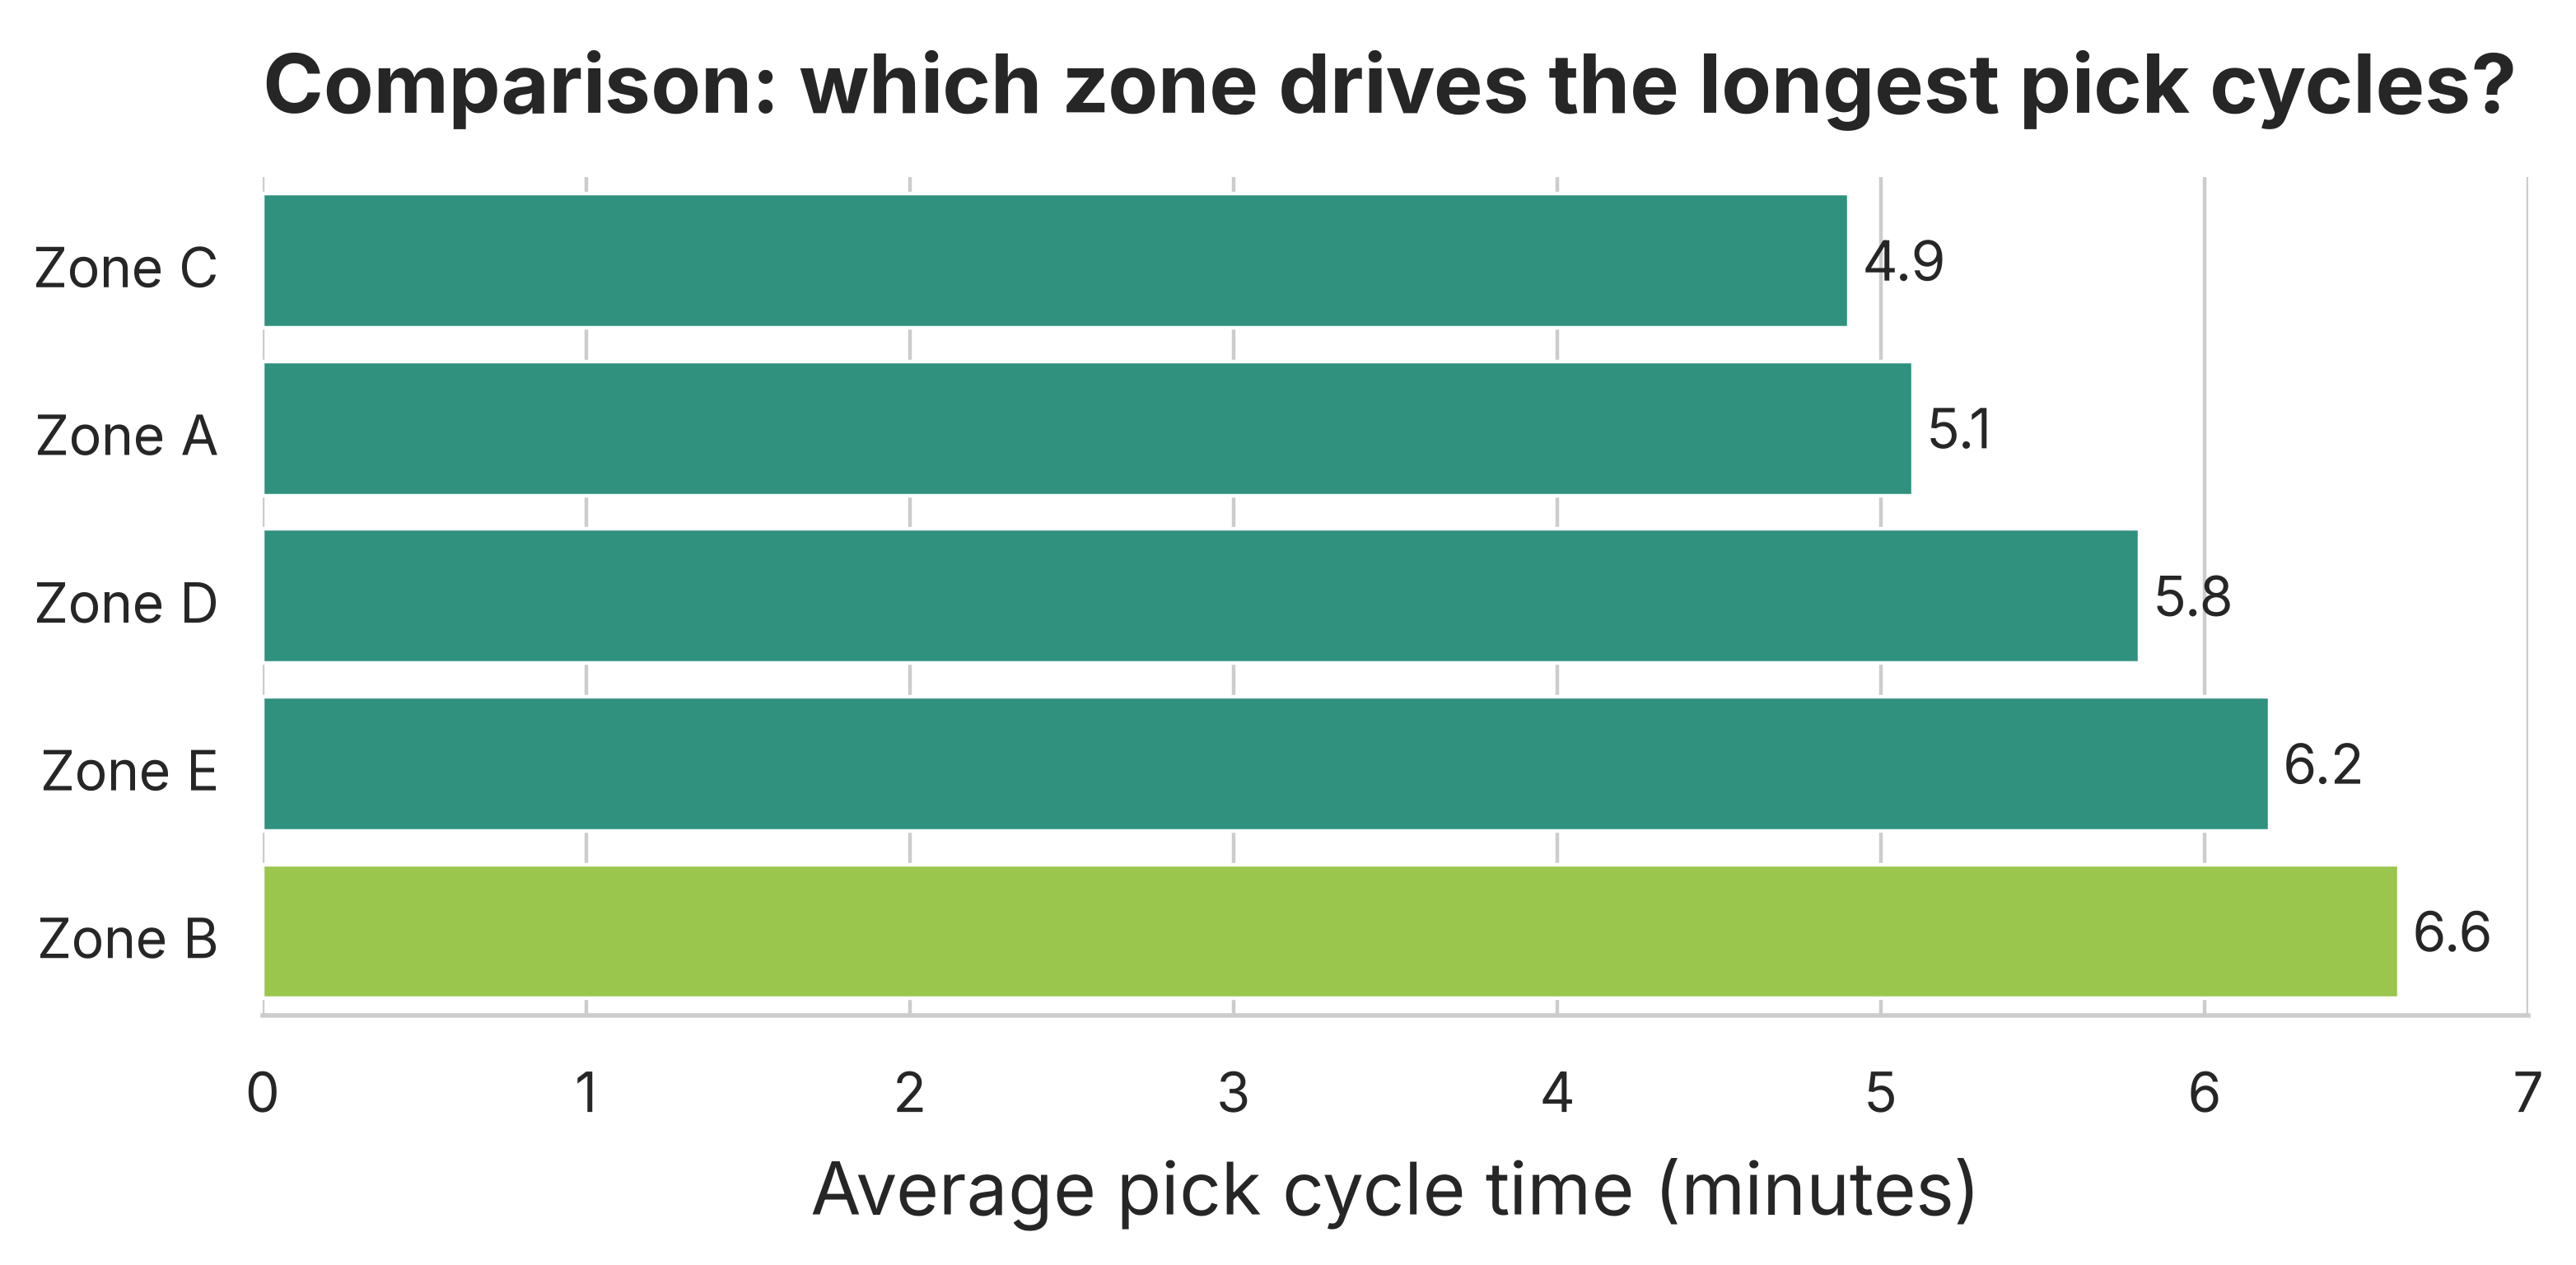
Sorting makes rank obvious; highlight only the category you want the room to discuss.
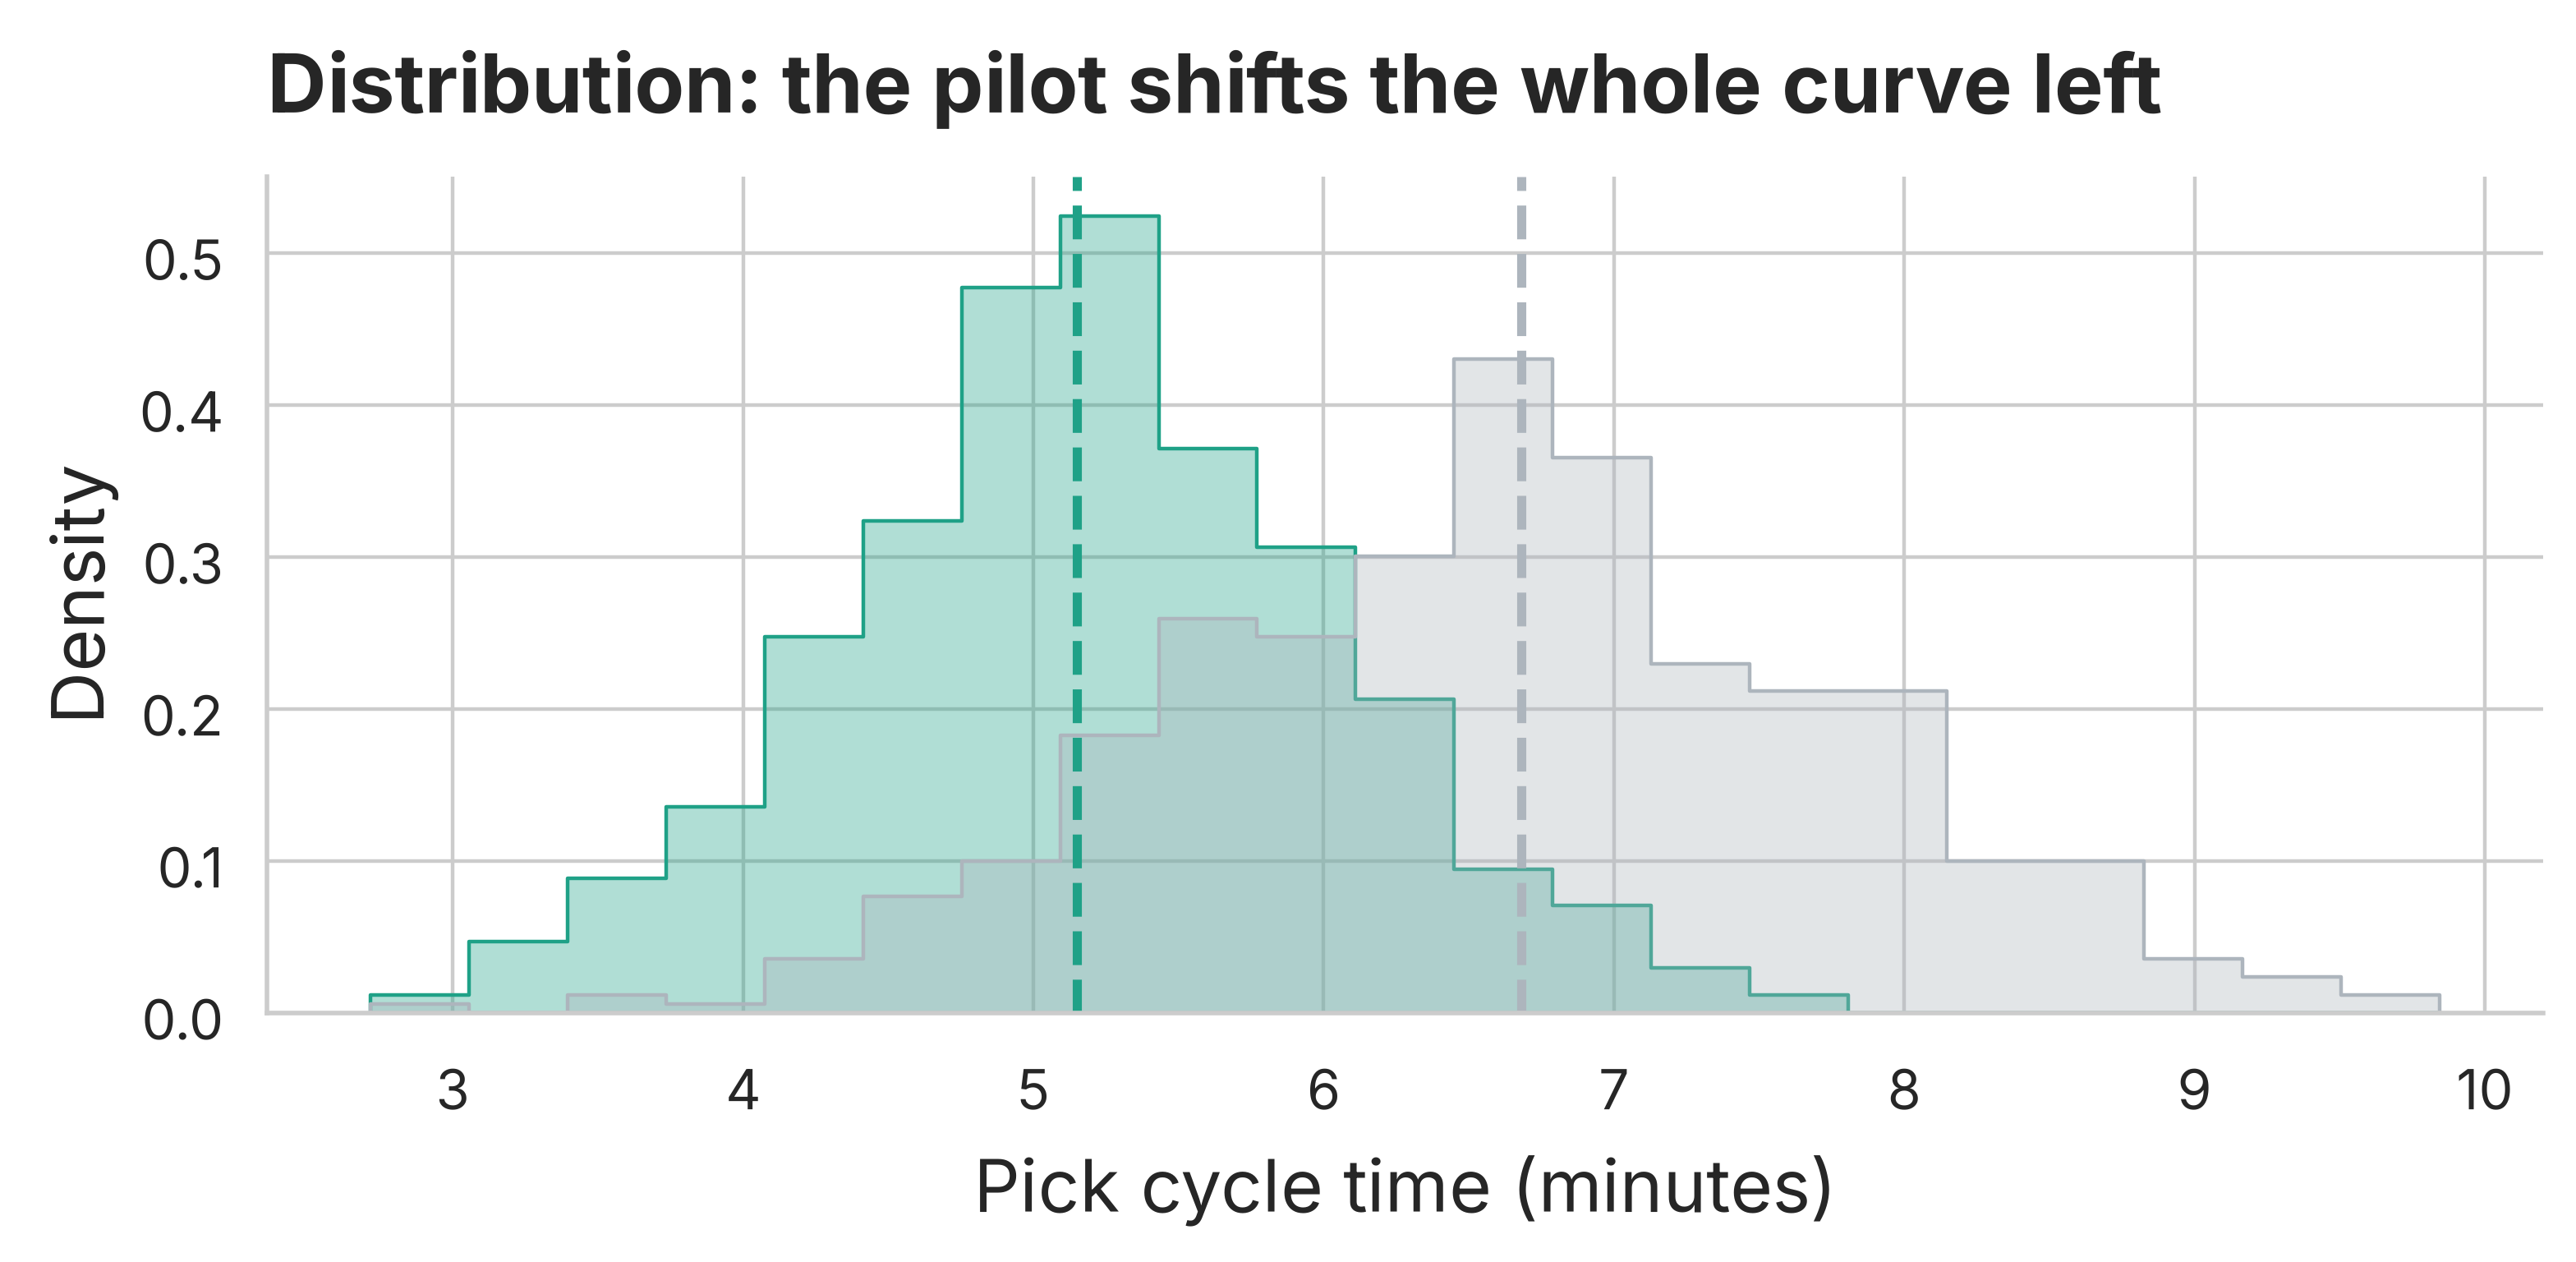
Readout
Medians can improve while the tail stays risky — distributions reveal where the pain remains.
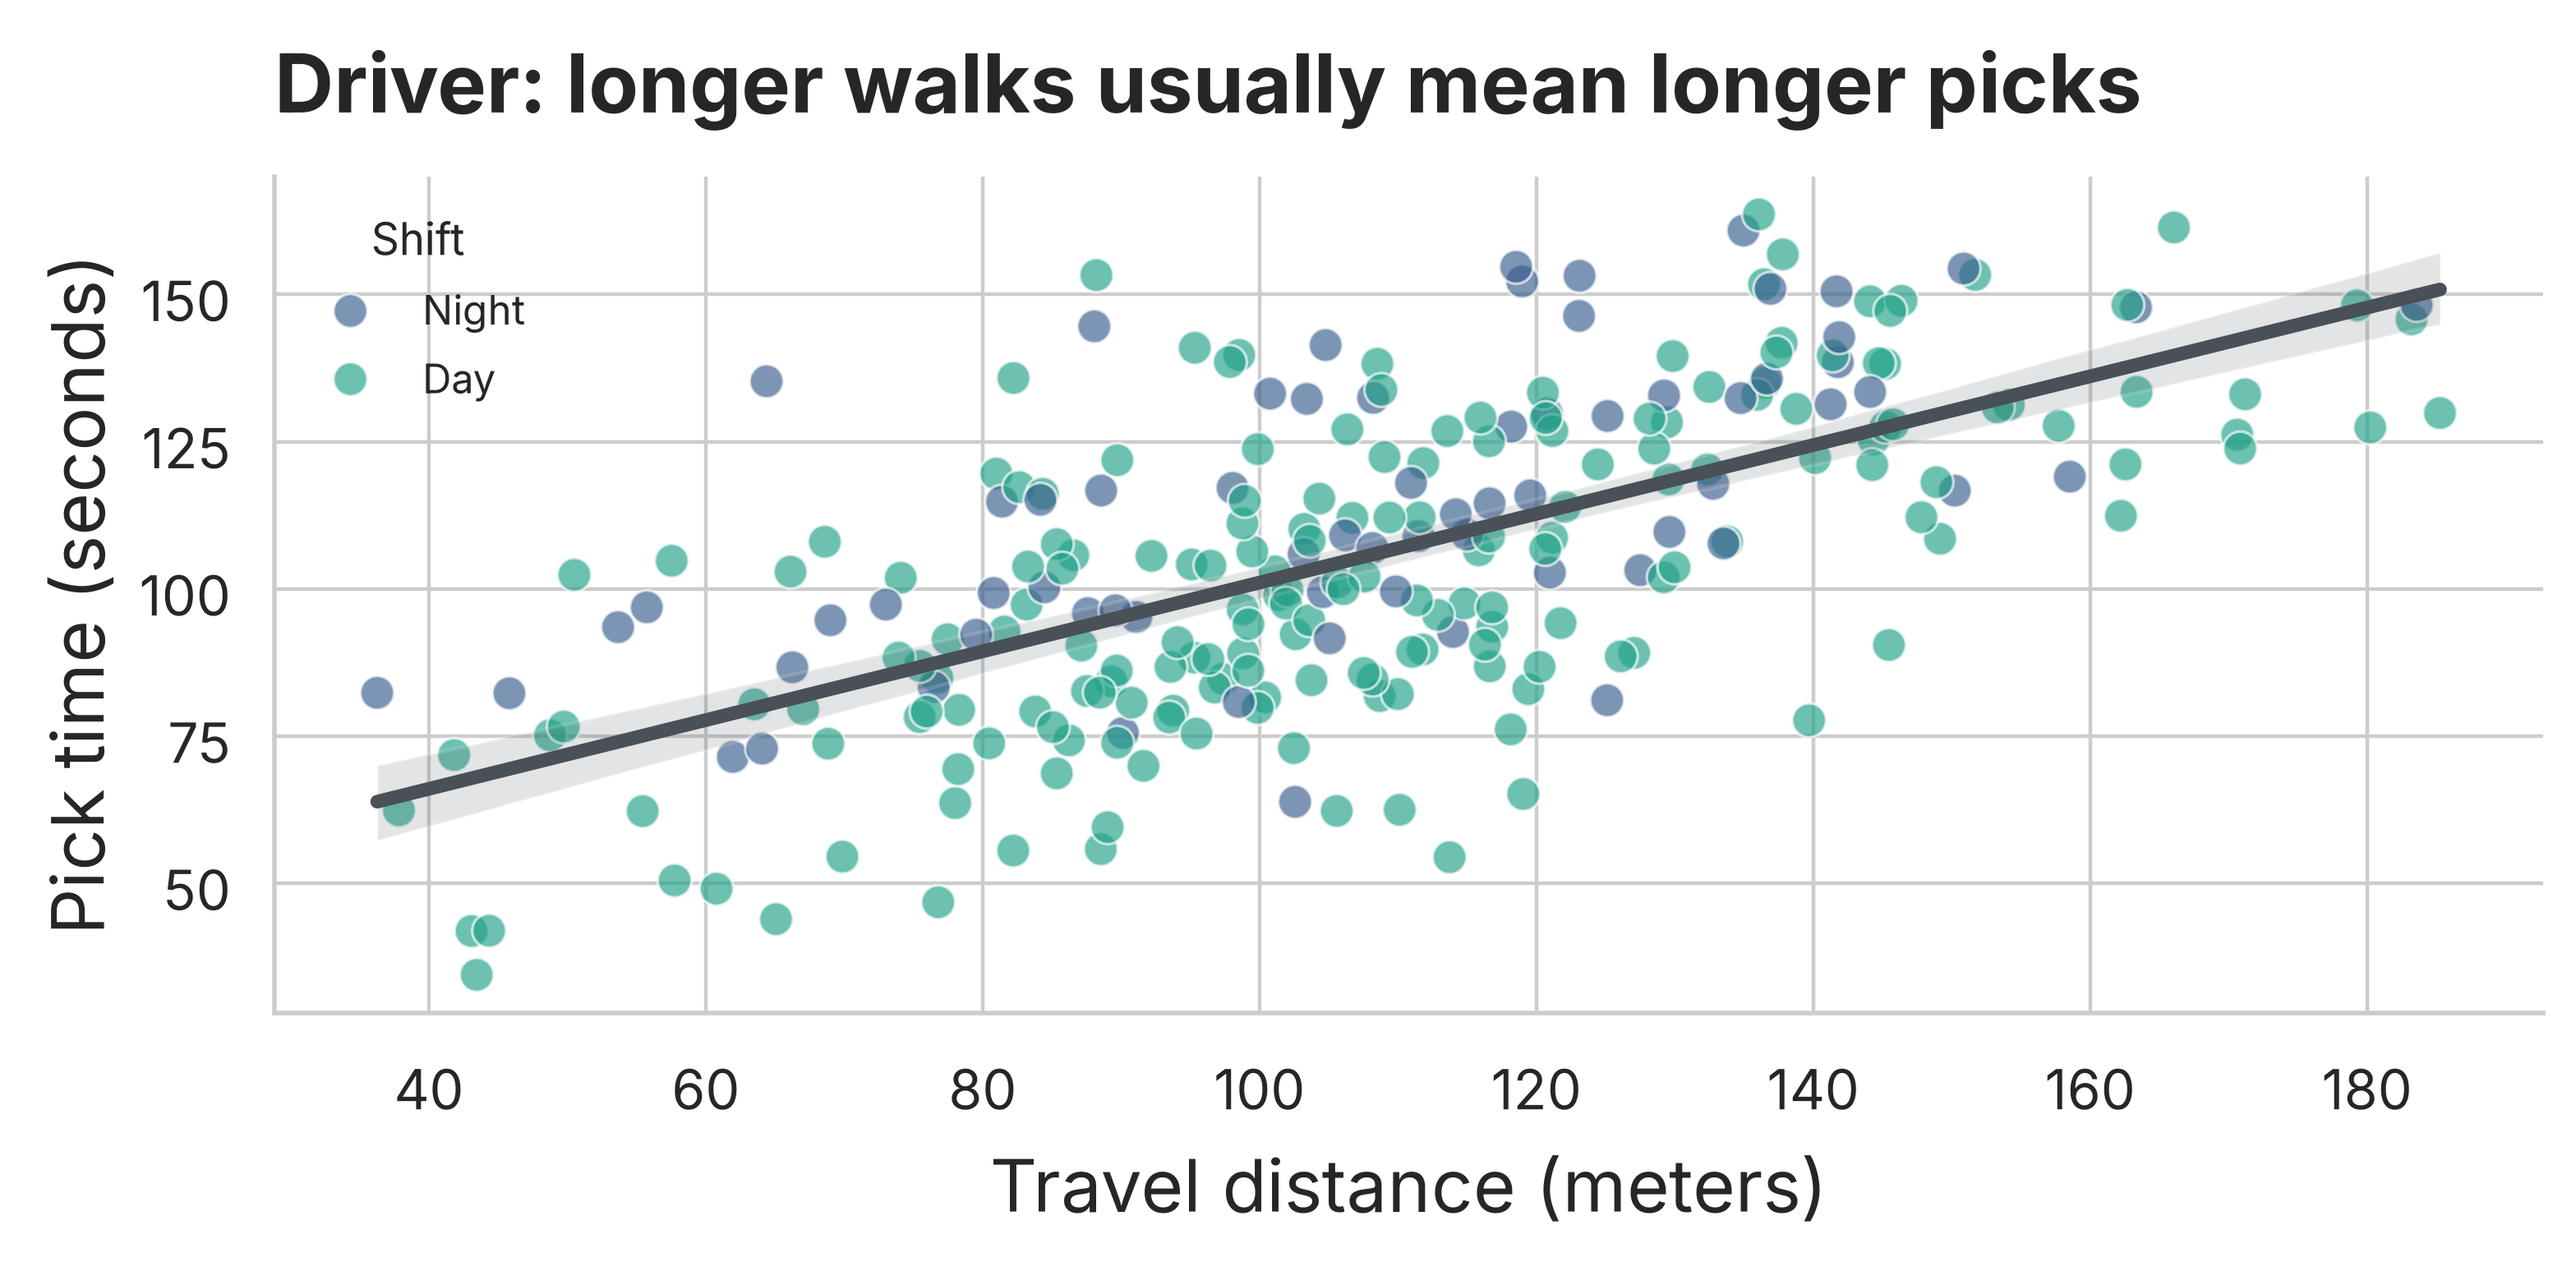
Readout
When you argue about drivers, show the raw points and the trend — not just a correlation coefficient.
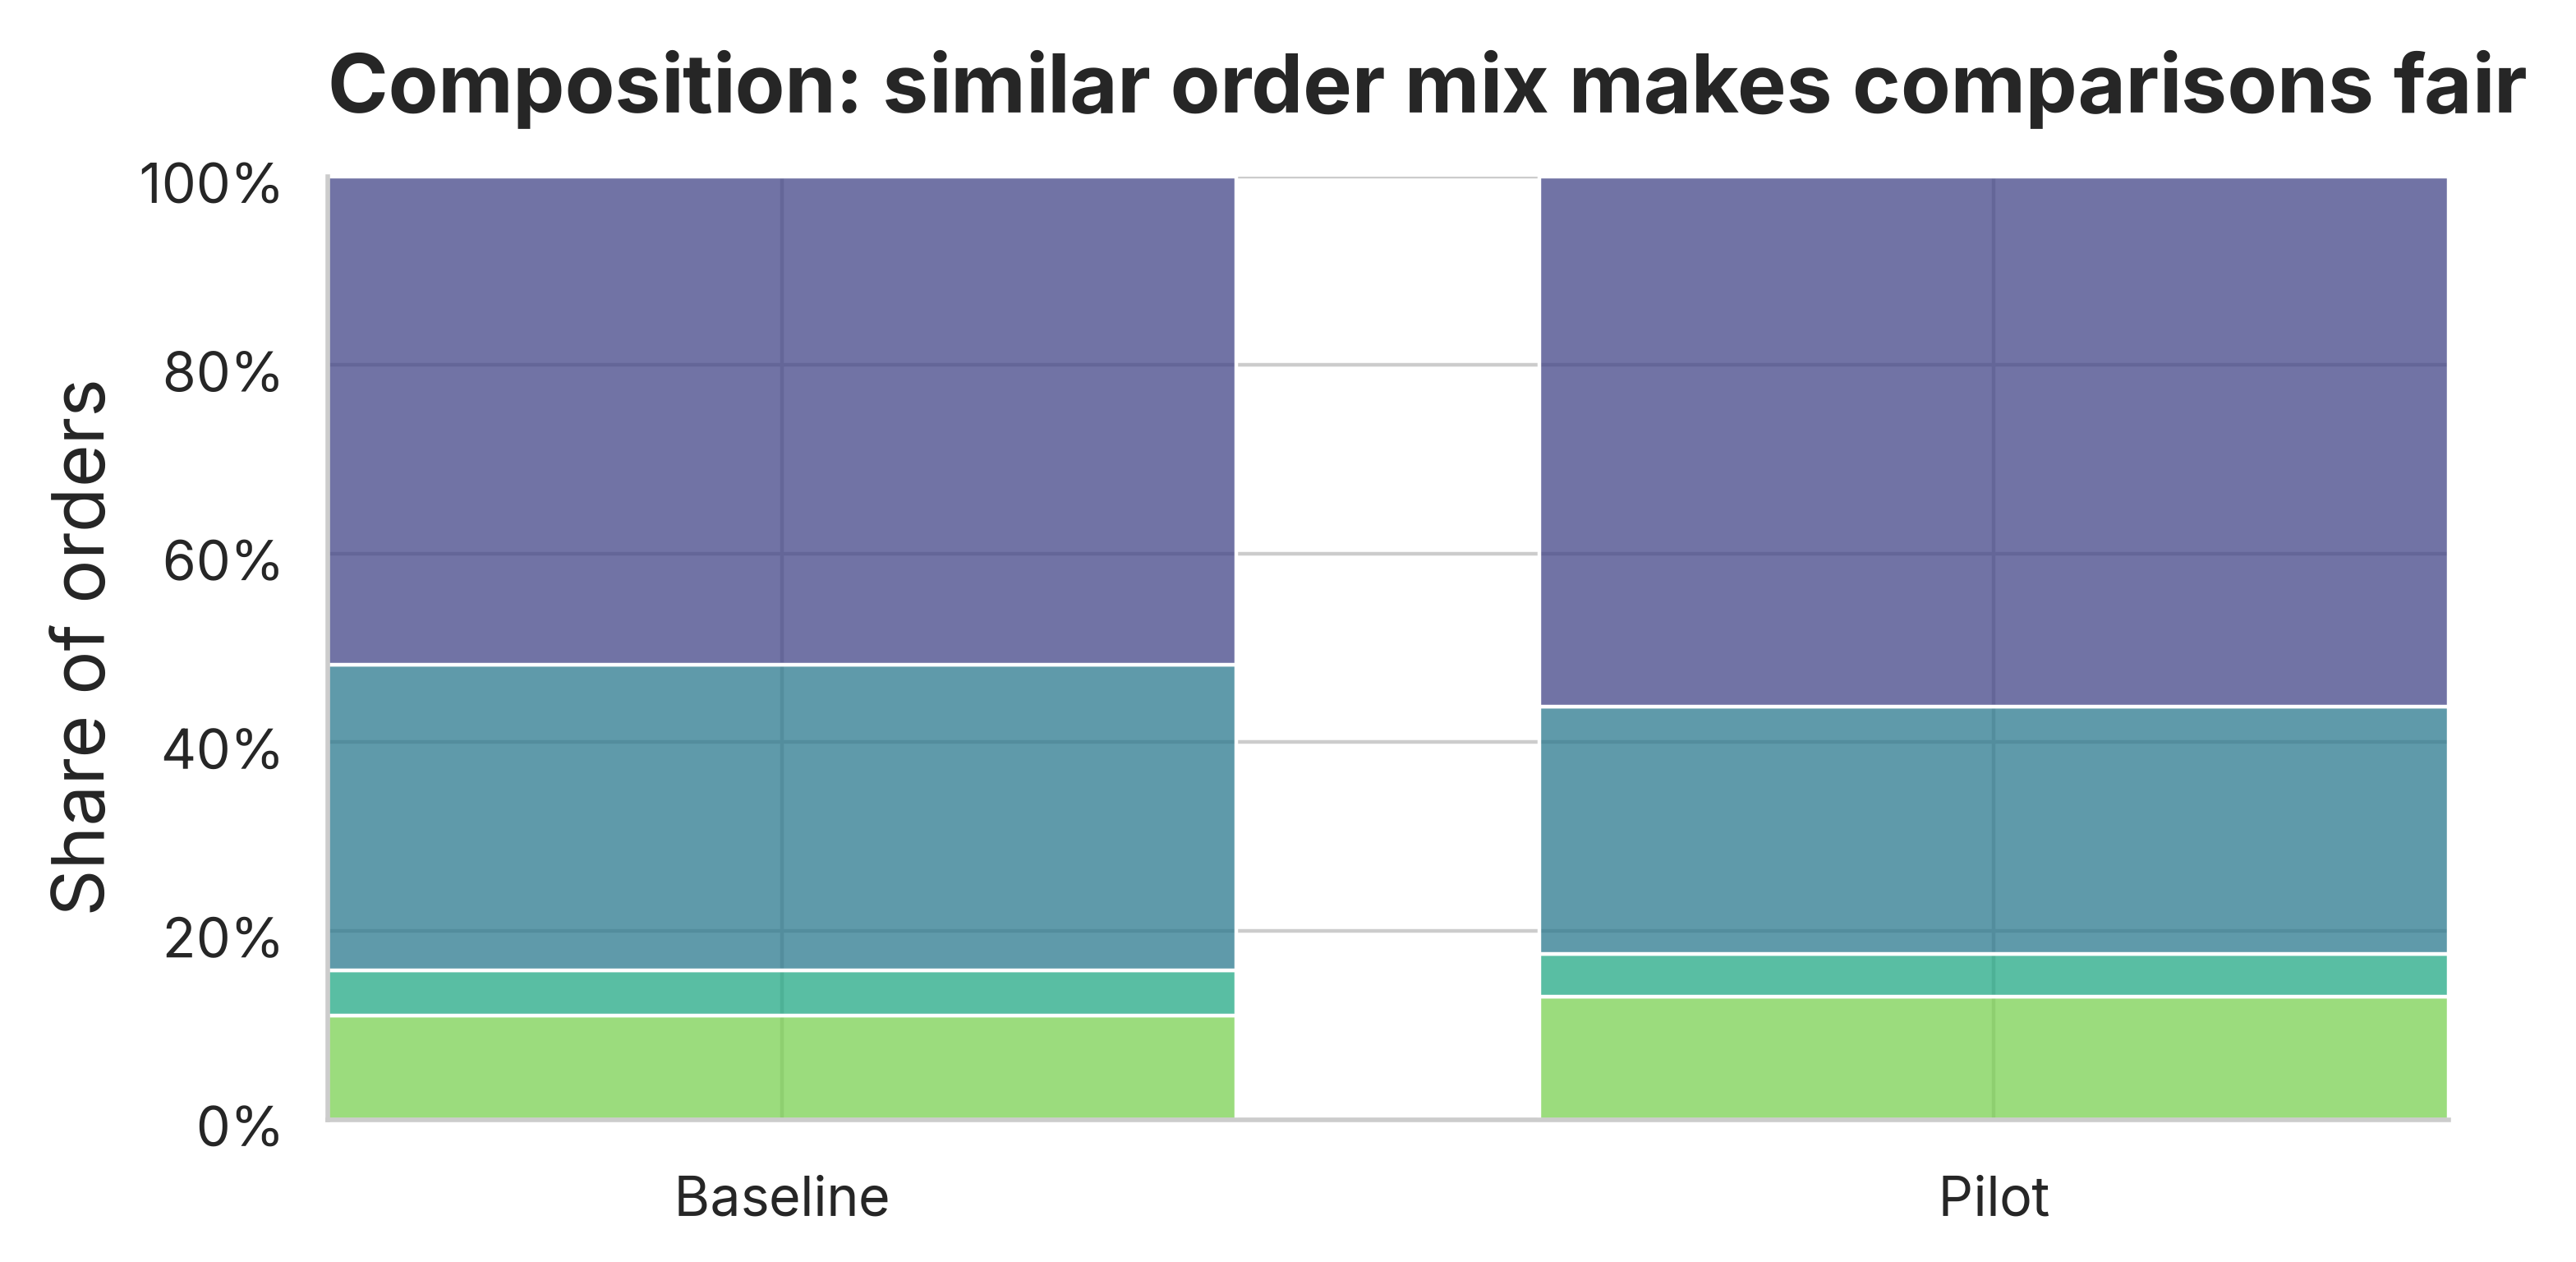
Readout
If the mix changes, KPI changes may be case-mix, not process improvement.
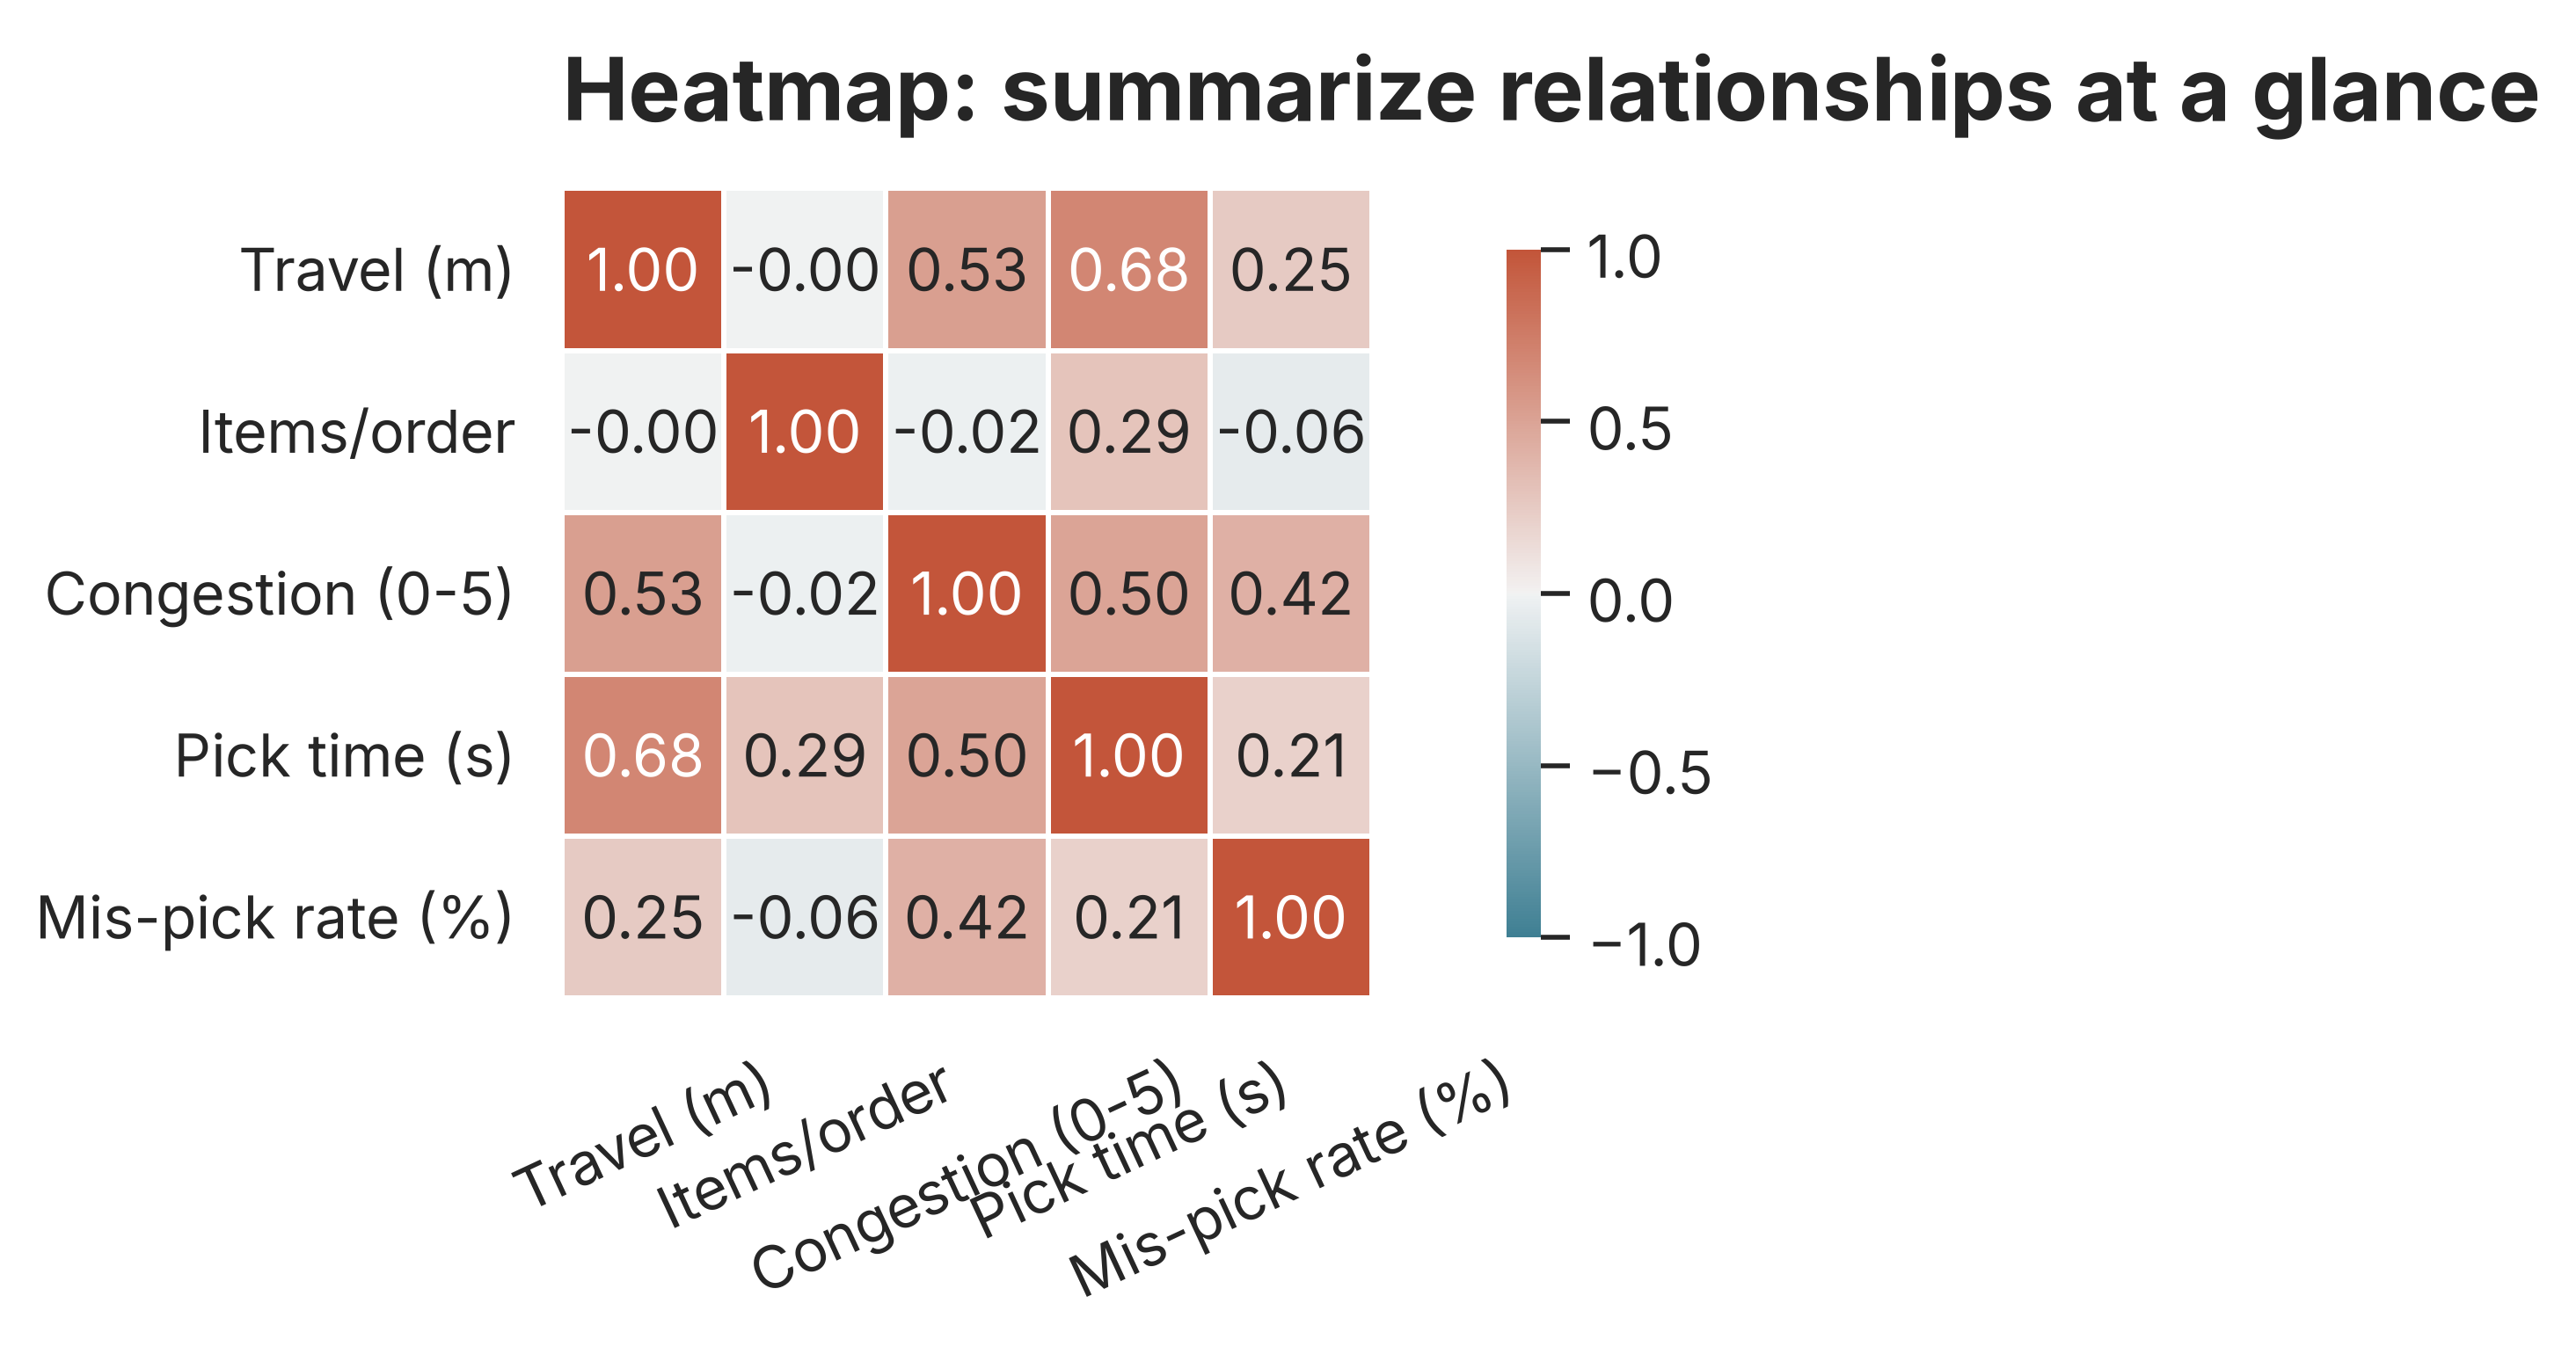
Readout
Heatmaps are for pattern recognition — use them to find questions, then follow up with detailed charts.