Diagnose the distribution. Design for the observed work.
Foundations
01
The analysis answers four warehouse questions
Which customers, SKUs, and locations generate the work?
Which orders require distinct picking and handling flows?
When does released workload exceed normal capacity?
Which warehouse changes deserve a quantified operating test?
Diagnose the workload before choosing equipment
Validate transactions. Connect orders, items, inventory, and locations.
Describe the workload. Expose concentration, mix, scale, and timing.
Locate causes. Trace material-flow and information-flow problems.
Test a redesign. Screen process, storage, and MHE options before selecting an experiment.
Design rule
Diagnose the warehouse activity before prescribing equipment, storage, or picking methods.
Nine disciplines keep profiling decision-ready
Understand the work
Preparation: study the operating pattern
Participation: validate with warehouse teams
Pictures: make every figure self-contained
Challenge the design
Power: eliminate methods that do not fit
Probity: test preferred equipment against data
Principle: measure concentration; never assume it
Decide at the right depth
Purpose: design for distributions and peaks
Perspectives: connect activity to space
Pitfall: stop when the next test is clear
Operating principle
A useful profile narrows the warehouse design space and defines the next operating test.
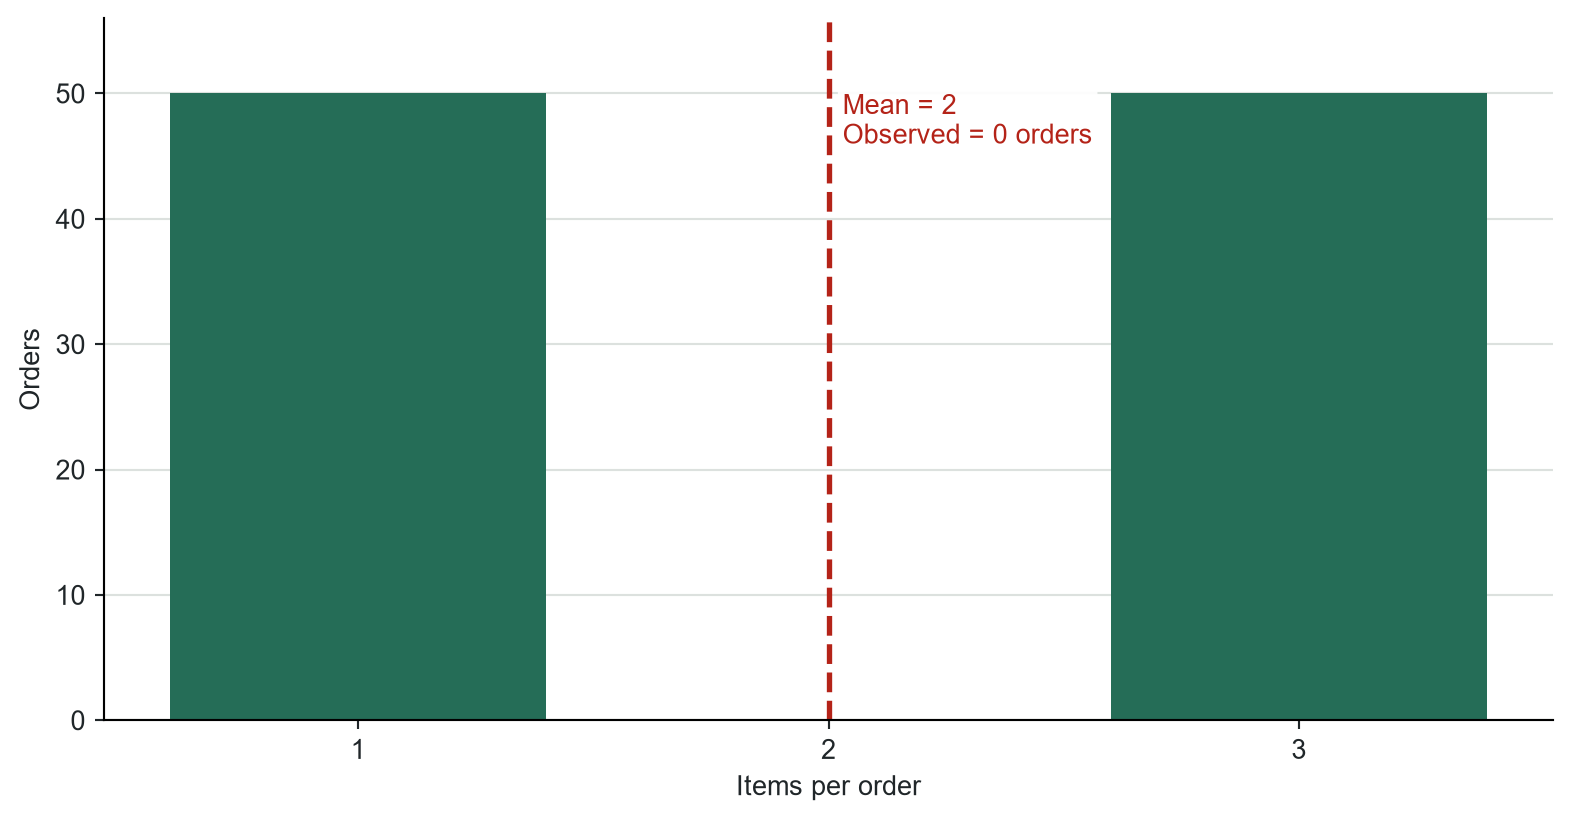
The mean describes no order
Figure 1: No order equals the two-item average in this 100-order sample.
Two operating modes
50 orders contain 1 item.
50 orders contain 3 items.
The 2-item mean never occurs.
Design separate handling rules for the two recurring order types.
The case contains 2.25 million order lines
The analysis uses anonymized 2004 operating records from an office-products distributor:
Table 1: Population used by the activity profiles.
Population
Coverage
Order lines
2,249,630
Customer orders
883,910
Active SKUs in sales
31,423
Customers
1,097
Study period
January–December 2004
The source includes order identifiers, customers, SKUs, suppliers, shipped quantities, timestamps, dimensions, case packs, and monthly inventory (Bartholdi and Hackman 2019).
Overnight service makes peak release the constraint
Business and service
Customer promise and order cutoff
Special handling and product restrictions
Seasonality and SKU introduction rate
Receipts and shipments per operating day
Work and capacity
Warehouse area and storage modes
Pick lines, orders, and handling units per day
Units, cases, and pallets per pick line
Pickers, shifts, docks, and material-handling equipment
Service consequence
The distributor accepts late orders and ships overnight. That service promise makes peak-hour picking, route completion, and workload concentration more important than annual averages.
Orders, lines, and SKUs answer different questions
Table 2: The unit of analysis determines which warehouse question the profile can answer.
Observation
Typical records
Profiles supported
Order header
Customer, release time, service requirement
Order size, mix, and timing
Order line
SKU, quantity, UOM, status, lot or serial
Handling work and increments
SKU
Unique stocked item and packaging data
Popularity, cube, and inventory
Choose the correct unit of analysis
Aggregation rule
Choose the unit of analysis before aggregating. One order, one order line, and one SKU are not interchangeable observations.
Packaging definitions change the handling mix
Table 3: Packaging conversions required for handling-mix and order-increment profiles.
Handling level
Operational meaning
Required conversion
Each
Selling unit picked individually
Eaches per inner pack
Pack
Group of eaches handled together
Packs per case
Case
Standard shipping or storage carton
Eaches per case
Pallet
Unit load containing cases
Cases per pallet and layers per pallet
Warehouse convention
“Box,” “carton,” “case,” and “inner pack” are not universal levels. Confirm the company’s definitions before calculating full-case or pallet fractions.
Six linked datasets connect demand to space
Table 4: Data sources and warehouse activity profiles they support.
Data source
Essential warehouse fields
Profiles enabled
Item master
SKU, family, dimensions, case pack, status
Item, cube, handling mix
Order history
Order, customer, SKU, quantity, UOM, timestamp
Order and calendar-clock
Inventory history
SKU, on-hand, period, location
Inventory and capacity
Layout
Aisles, storage blocks, docks, travel paths
Distance and congestion
Location master
Zone, aisle, bay, level, position, SKU
Spatial activity and slotting
Storage-unit data
Address, dimensions, capacity, handling unit
Storage-mode assignment
Data integrity connects profile sources
Data integrity
Stable keys, time-valid conversions, and location addresses connect six warehouse data sources.
Location addresses convert picks into spatial demand
Storage address
Zone B / Aisle 231 / Bay C / Level 3 / Position A
2D activity map
Use zone, aisle, and bay to analyze travel and congestion.
3D storage analysis
Add level and position to analyze ergonomics and vertical handling.
Normalize location addresses before mapping
Location integrity
“B-231-C-3-A” and “b-231-c-3-a” may become different keys. Normalize format, then report duplicate and unmapped addresses.
Every profile ends in an operating test
Connect order lines, item master, inventory, and locations.
Validate units, dates, and keys.
Aggregate by the stated unit of analysis.
Plot the full distribution.
Ask whether the pattern changes a warehouse decision.
Define an improvement strategy, or revise the metric and stop.
Ten checks make a profile credible
Warehousing decision
Scope and study period
Unit of analysis
Calculation and units
Data preparation
Assumptions and limitations
Consistent comparison
Chart completeness
Key findings
Improvement strategy
Credibility rule
A credible profile addresses all ten checks. A missing denominator, period, or limitation can change the warehouse conclusion.
Four Frazelle families plus spatial activity
Table 5: Course implementation of Frazelle’s four profile families plus a spatial extension.
Warehouse activity
Profiles
Profile types
Primary decisions
Spatial activity
1
Pick frequency
Slotting and travel
Customer orders
16
Pareto, composition, volumetric, calendar-clock
Picking process and capacity
Purchase orders
4
Pareto, composition, volumetric, calendar-clock
Receiving process and capacity
Item activity
6
Pareto and demand correlation
Storage mode and location
Item inventory
3
Inventory Pareto and handling units
Inventory review and storage system
Analytical total
30
Decision confidence follows evidence quality
Table 6: Evidence basis and the strength of a warehouse conclusion.
Evidence basis
Appropriate use
Evidence required before implementation
Observed transactions
Diagnose the measured workload
Current constraints, cost, service, and stability
Substitute field
Screen a warehouse method
The intended WMS event or master-data field
Modeled scenario
Test calculation logic and sensitivity
Company observations from the proposed process
Investment rule
Capital decisions require current physical, service, capacity, labor, and cost evidence.
Warehouse work varies across space and time
Where
Demand: SKU, family, and handling unit
Space: zone, aisle, bay, level, and position
When
Calendar: month, ordinal week, weekday, and hour
Operation: wave, shift, cutoff, and peak period
Capacity rule
Combine spatial and calendar-clock profiles to size labor, equipment, storage, and docks.
Spatial activity profiles
02
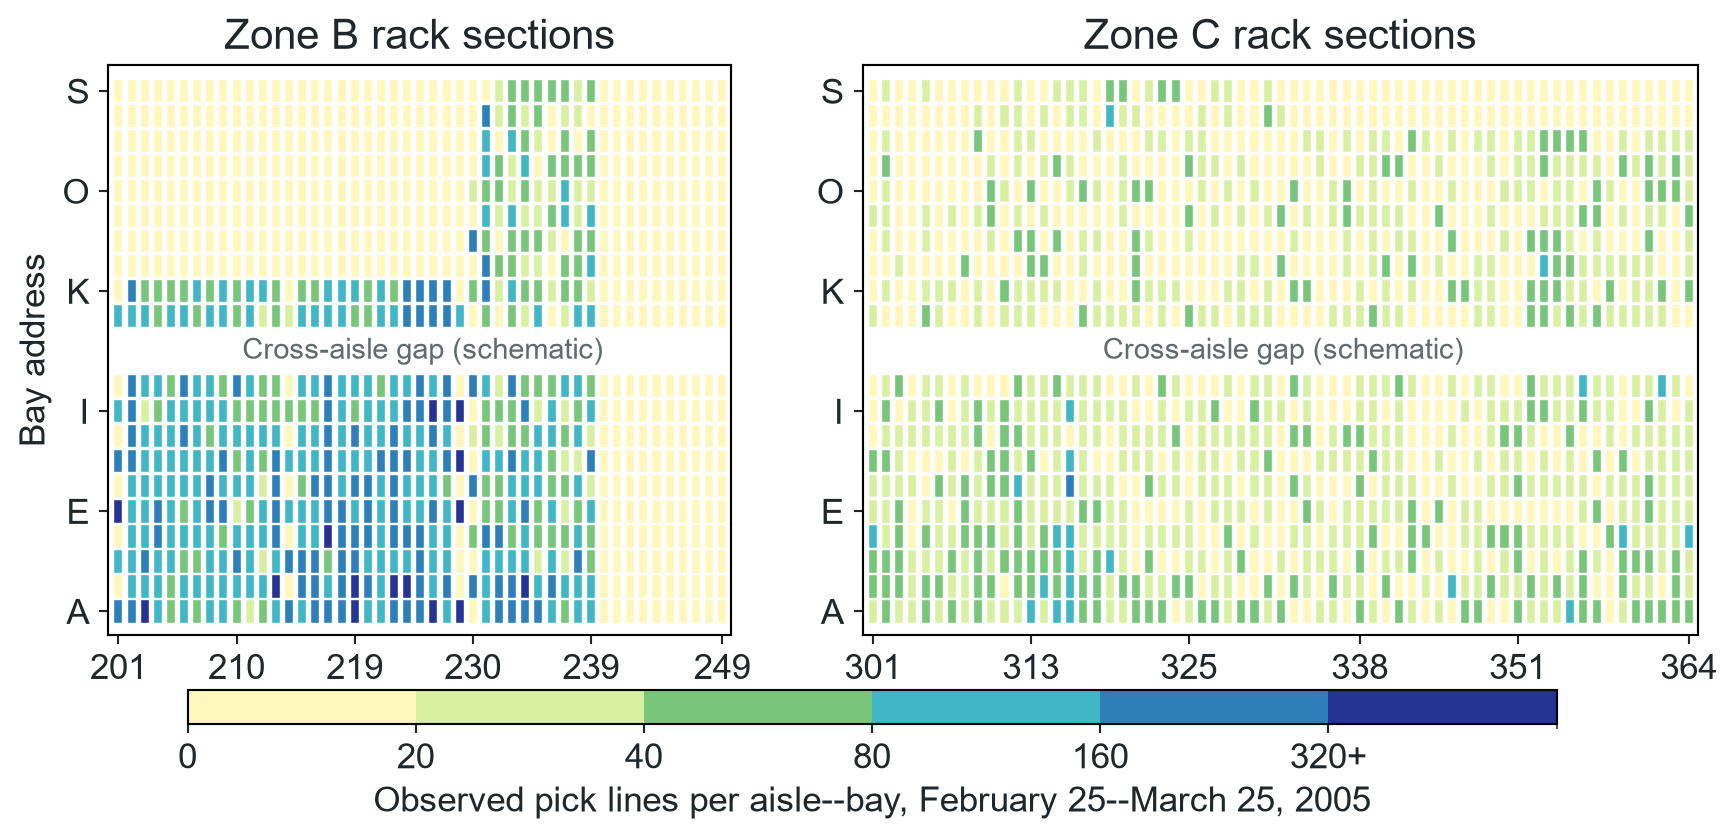
Hot aisle–bay cells identify slotting candidates
Figure 2: Observed pick lines by aisle–bay address with schematic rack spacing and one shared absolute scale.
Decision: Verify the travel map, then test hot addresses for re-slotting and zone balance.
Customer order profiles
03
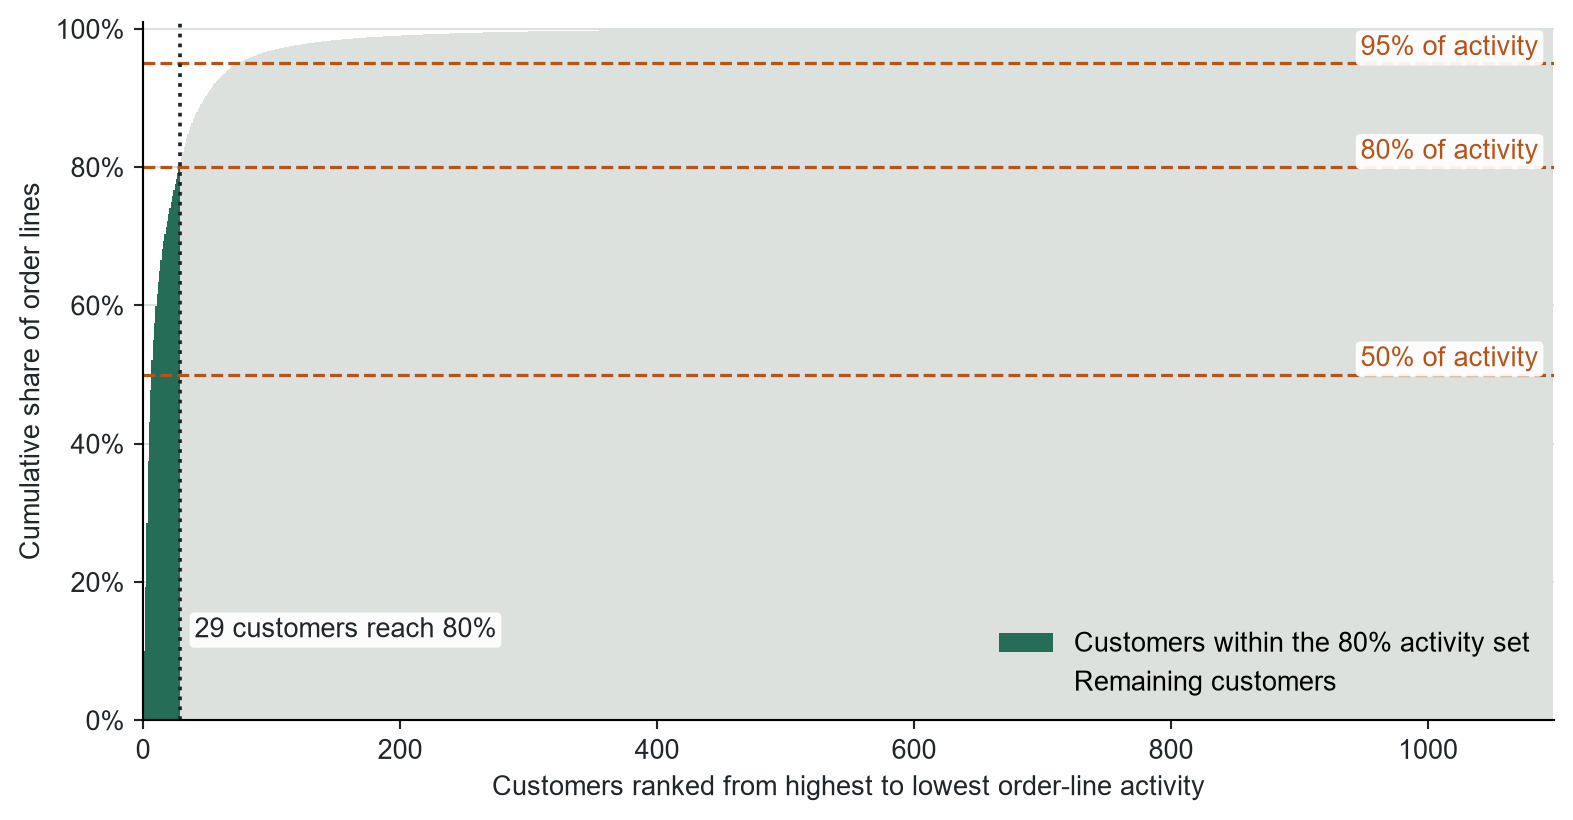
29 customers generate 80% of picking activity
Figure 3: Only 29 customers generate 80% of all order-line activity.
Warehouse response
Test dedicated processing cells for the 29 dominant customers, subject to assortment stability and mixed-order consolidation.
A processing cell needs stable concentration
Table 7: Example division of shared and dedicated resources in a warehouse-within-a-warehouse design.
Shared across the facility
Dedicated to the dominant customer or family
Receiving and reserve storage
Forward-pick locations
Building, utilities, and safety systems
Order release and picking rules
Main replenishment and shipping resources
Labor accountability and service measures
Common inventory where duplication is costly
Packing or value-added services when required
Use only when
Volume, assortment, and service requirements are stable enough to outweigh duplicated inventory, replenishment, space, and mixed-order consolidation.
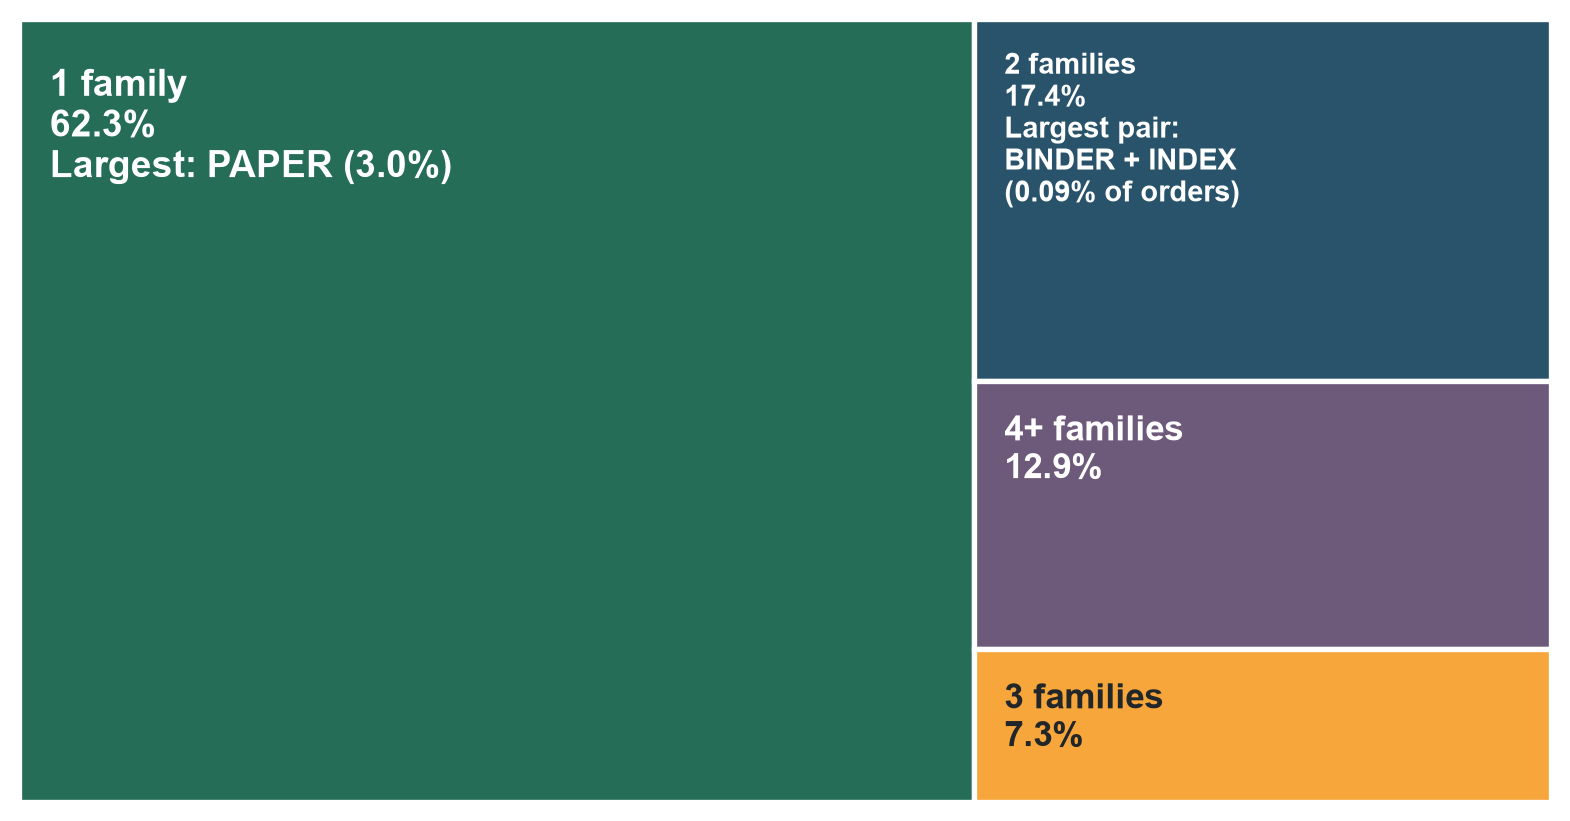
62.3% of orders stay within one product family
Figure 4: 62.3% of orders contain one description-based product family.
Warehouse response
Test family-based zones and a shared merge point for mixed orders.
Validate the description-derived families against the company’s handling groups before changing locations.
Mixed pallet demand limits process separation
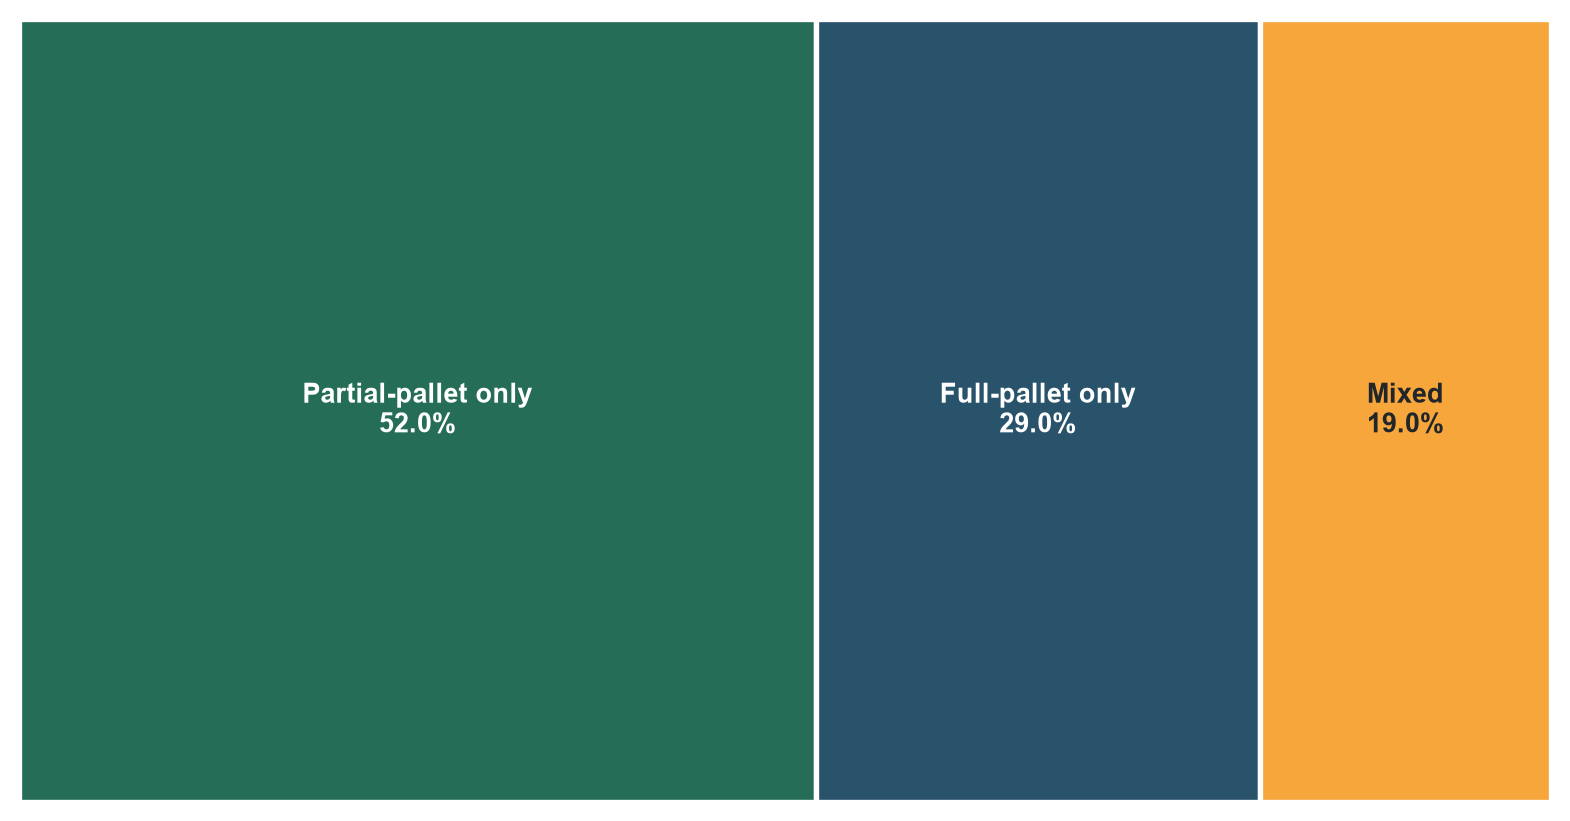
Figure 5: Scenario: 52% partial-only, 29% full-only, and 19% mixed.
Warehouse response
Test separate pallet and case-picking areas with one controlled merge process for the 19% mixed-order segment.
Scenario basis: 4,000 orders with fixed pallet quantities.
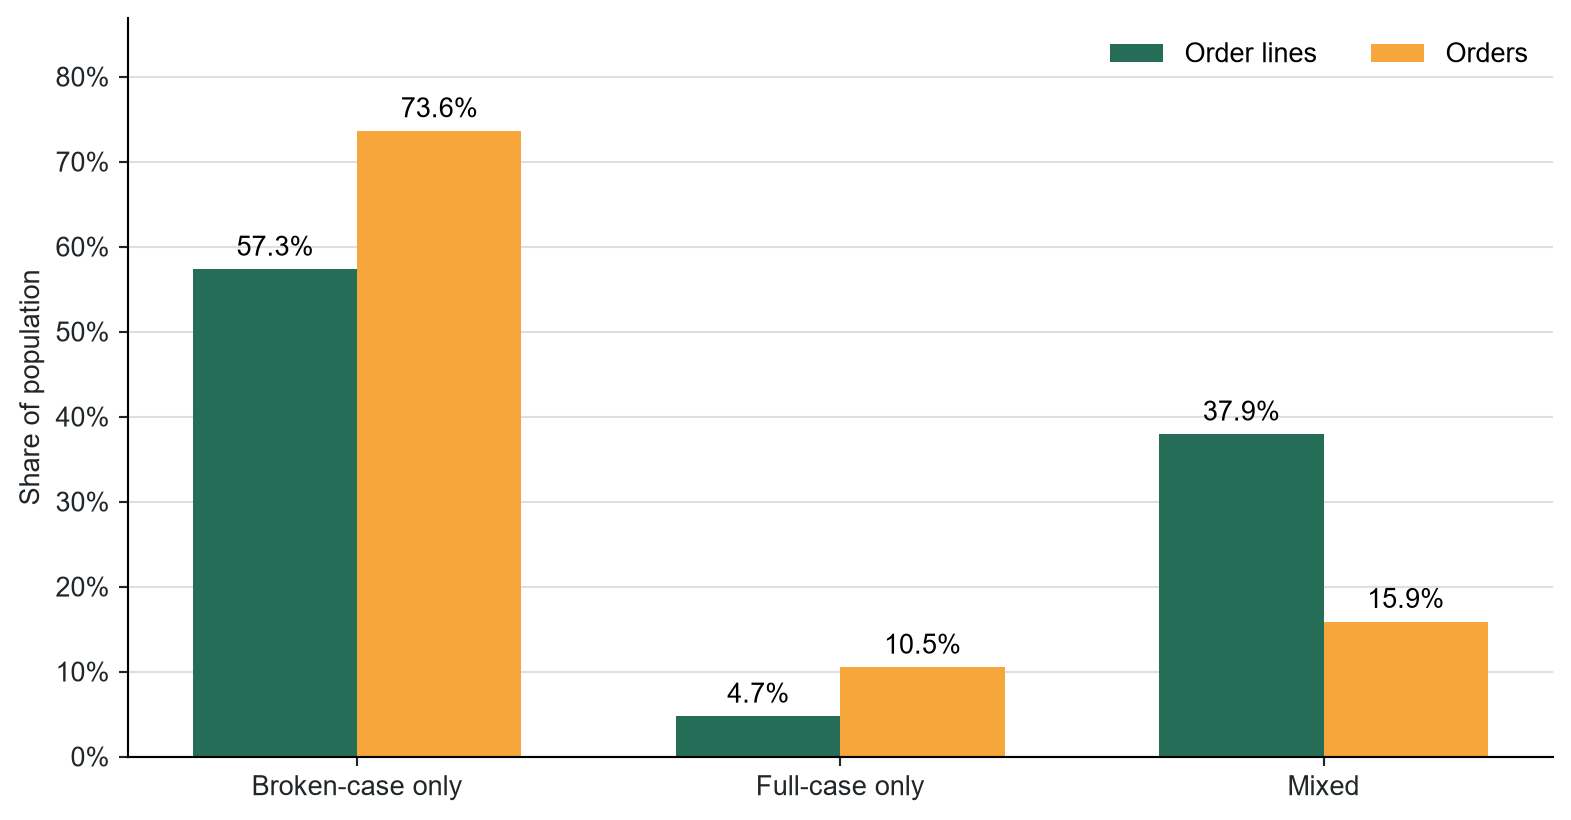
Mixed orders are 15.9% but carry 37.9% of lines
Figure 6: Mixed orders represent 15.9% of orders but 37.9% of their order lines.
Warehouse response
Size separate broken- and full-case processes and provide a merge path for the 15.9% mixed-order segment.
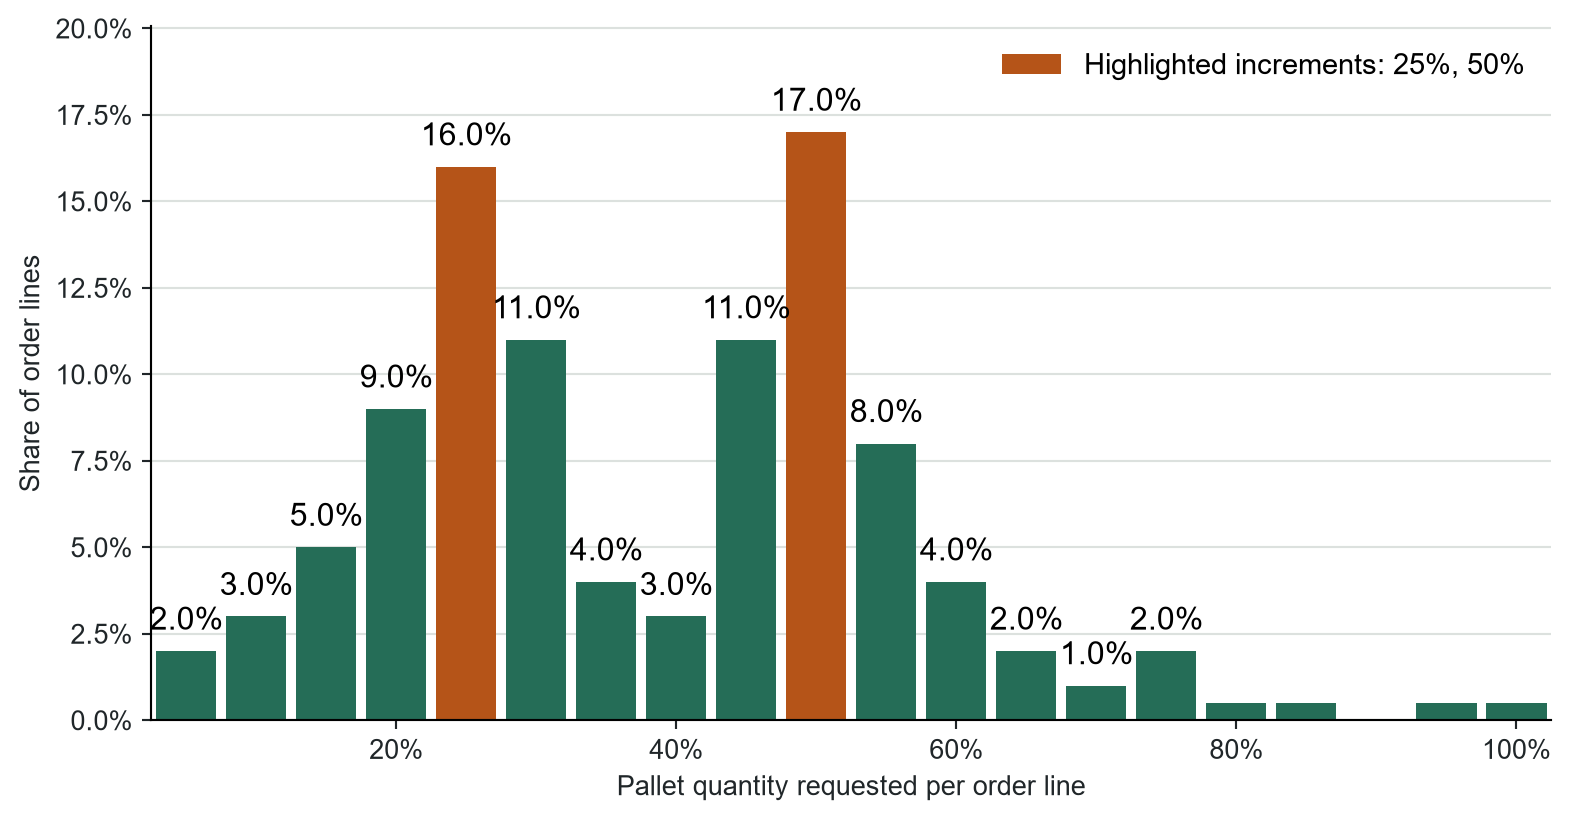
Pallet demand peaks at quarter- and half-pallet loads
Figure 7: Frazelle’s reference pattern peaks at 25% and 50% of a pallet.
Warehouse response
Collect pallet quantities, confirm the recurring increments, and test preconfigured quarter- and half-pallet loads.
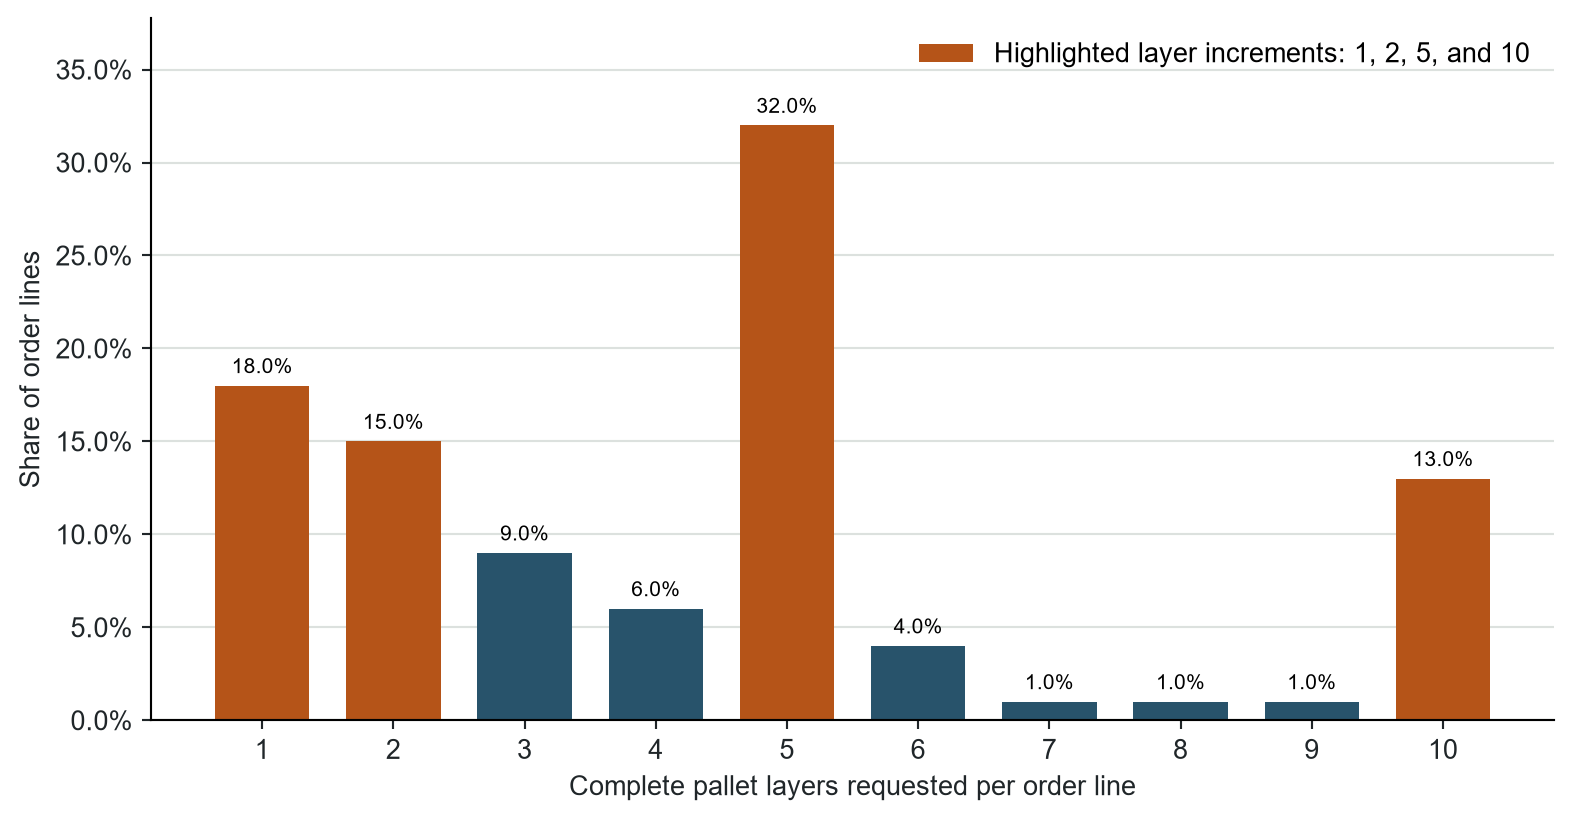
Layer demand concentrates at 1, 2, 5, and 10 layers
Evaluate layer-picking equipment, layer-sized replenishment, and supplier pallet patterns against case-picking labor and damage.
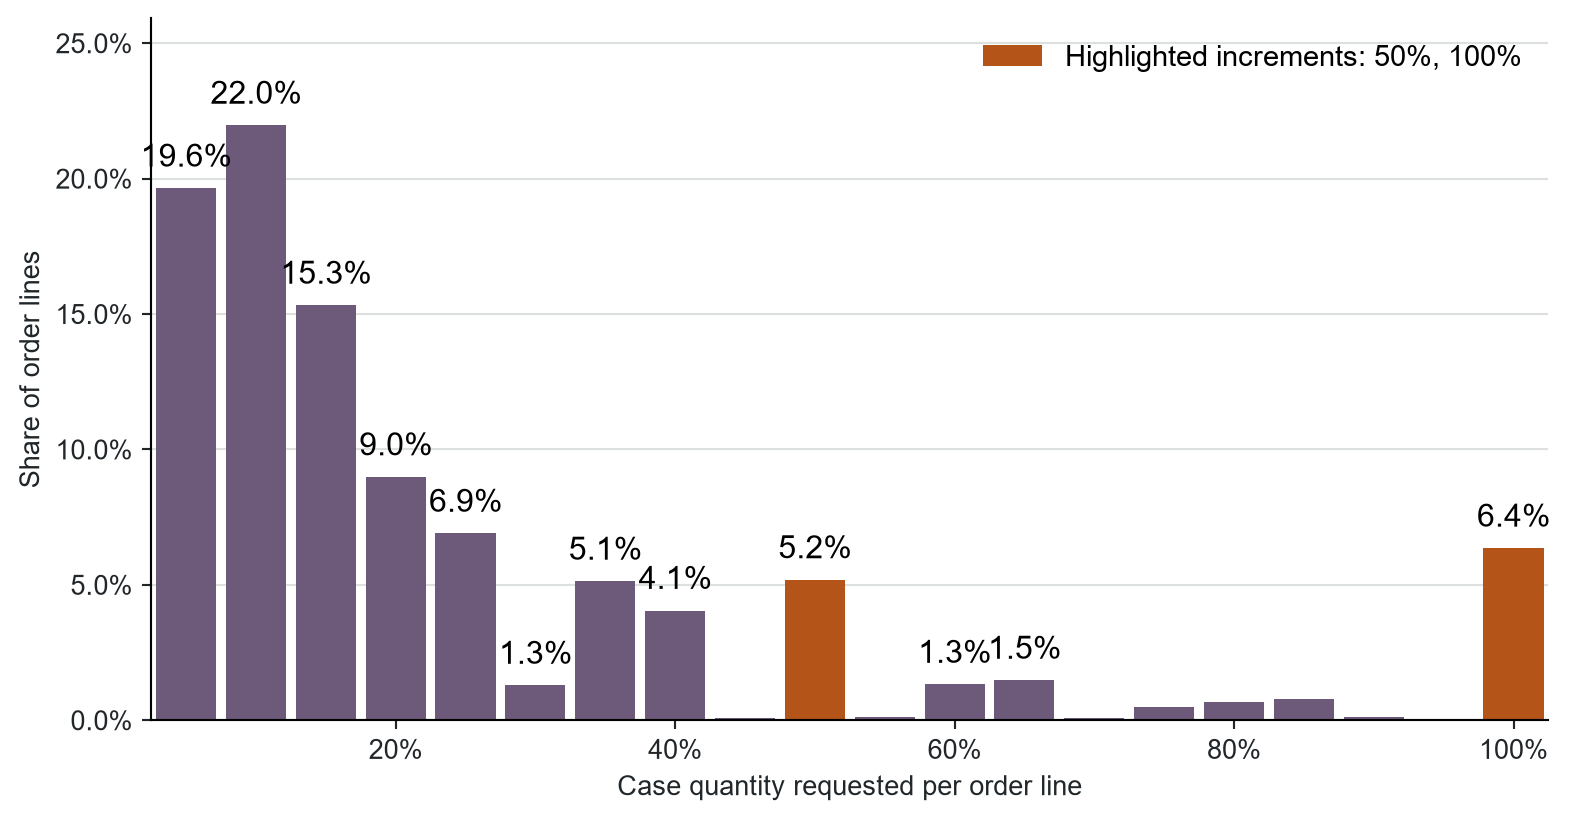
Only 5.5% of eligible lines request full cases
Figure 9: Among 1,857,186 eligible lines, 5.5% are exact full-case multiples; 6.4% fall in the 97.5%–100% case band.
Warehouse response
Test inner-pack sizes and commercial order increments at the persistent partial-case peaks.
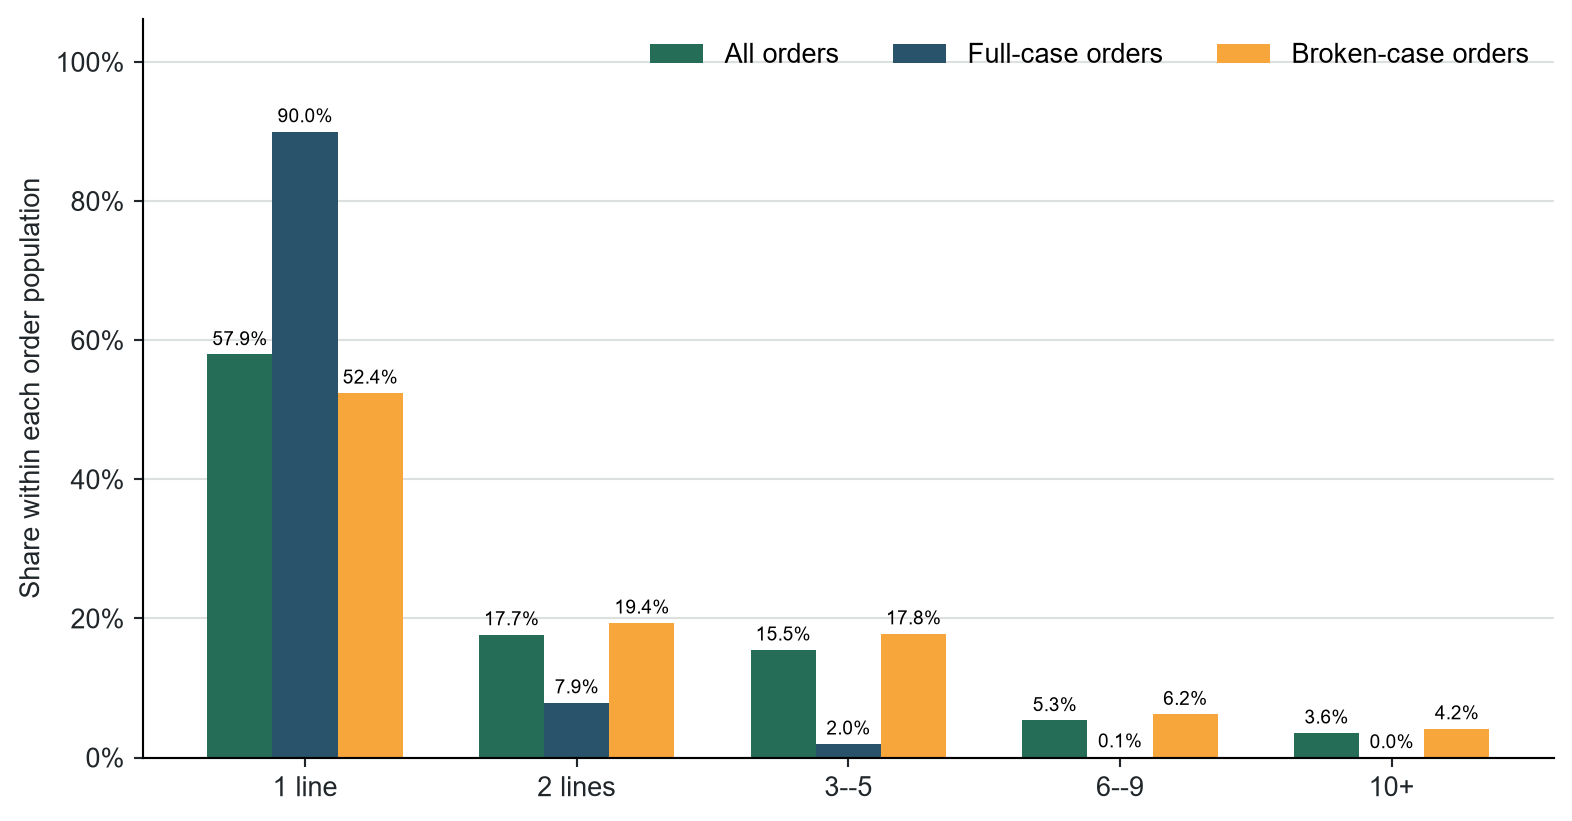
57.9% of orders visit one SKU location
Figure 10: Single-line orders represent 57.9% of 883,910 orders.
Warehouse response
Batch the single-line majority in location sequence; route the multi-line tail through cart or zone-wave picking.
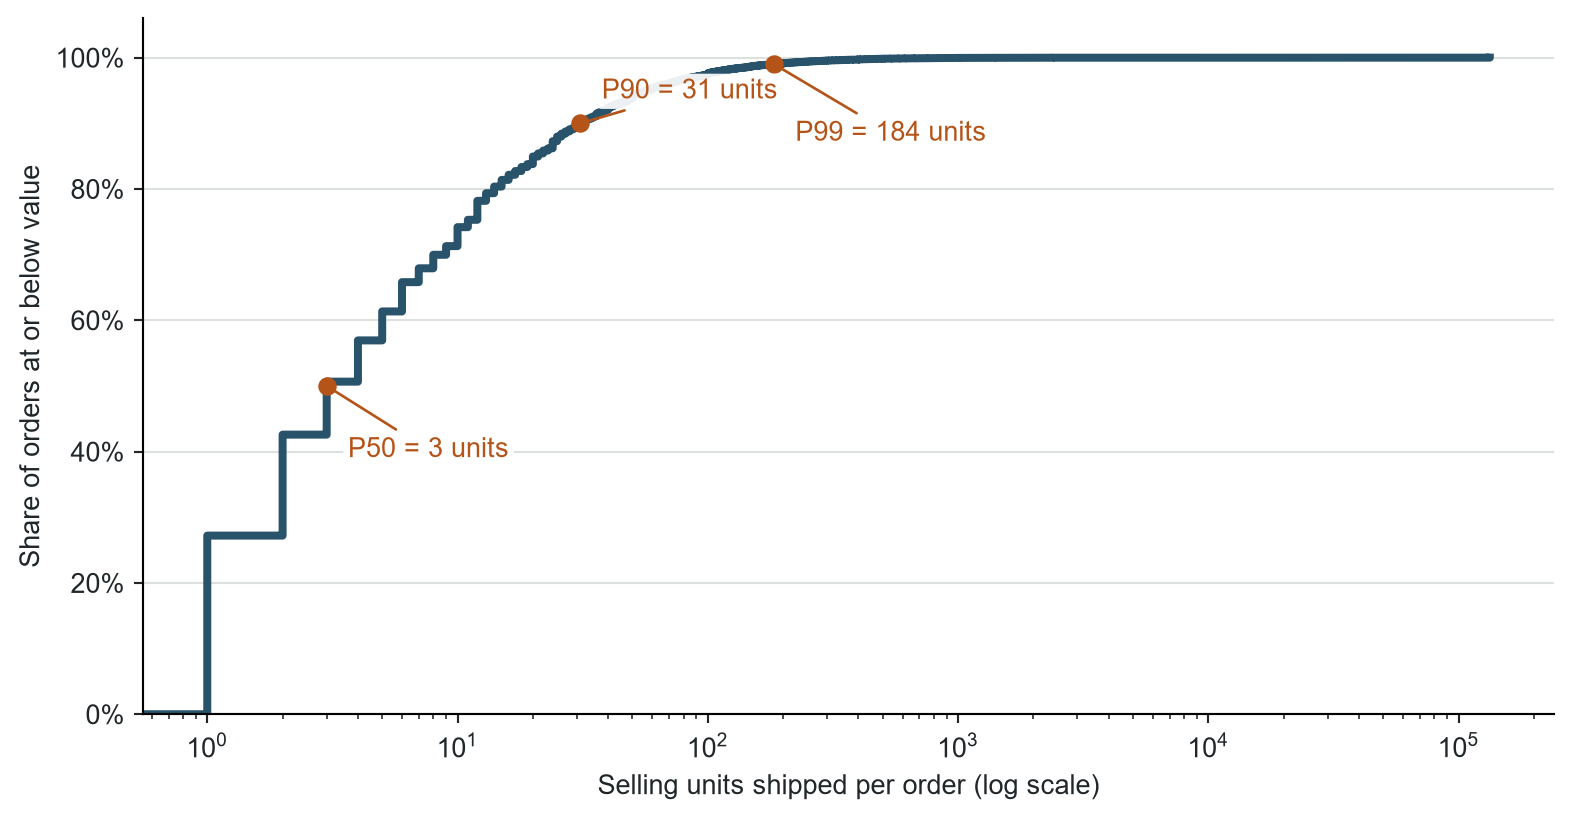
Half of all orders ship 3 units or fewer
Figure 11: Positive-shipment orders: median 3 units; 90th percentile 31.
Warehouse response
Use the order-size segments for commercial analysis. Use cube, mass, and pack hierarchy for equipment and container choices.
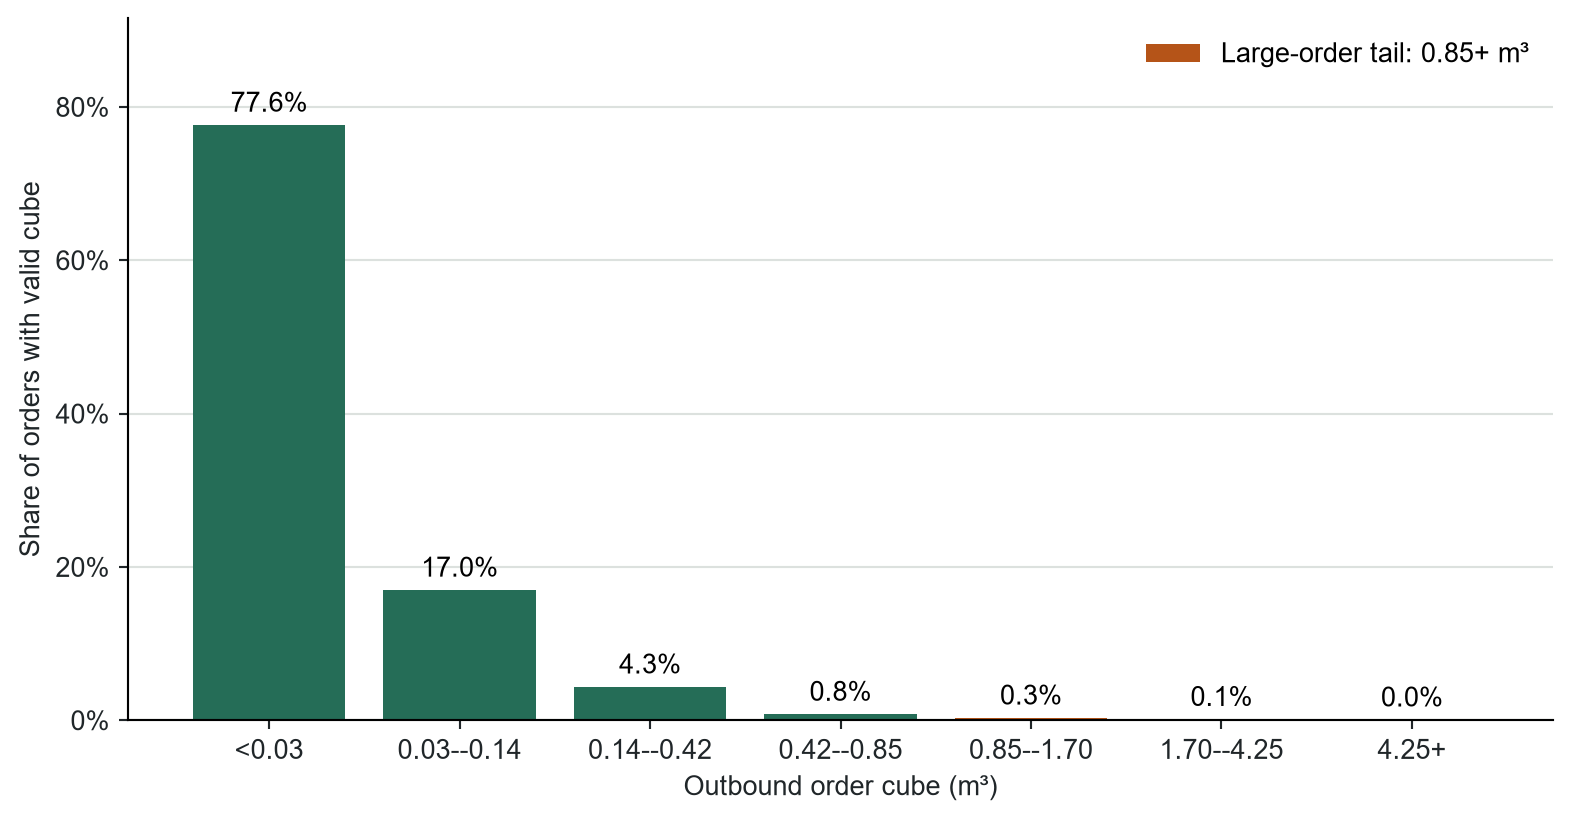
Median positive order cube is 0.0062 m³
Figure 12: The median positive-cube order occupies 0.0062 m³ before packing allowances.
Warehouse response
Define cube classes for cartons, totes, carts, pallets, and accumulation space.
49.1% of positive-cube orders are small singles
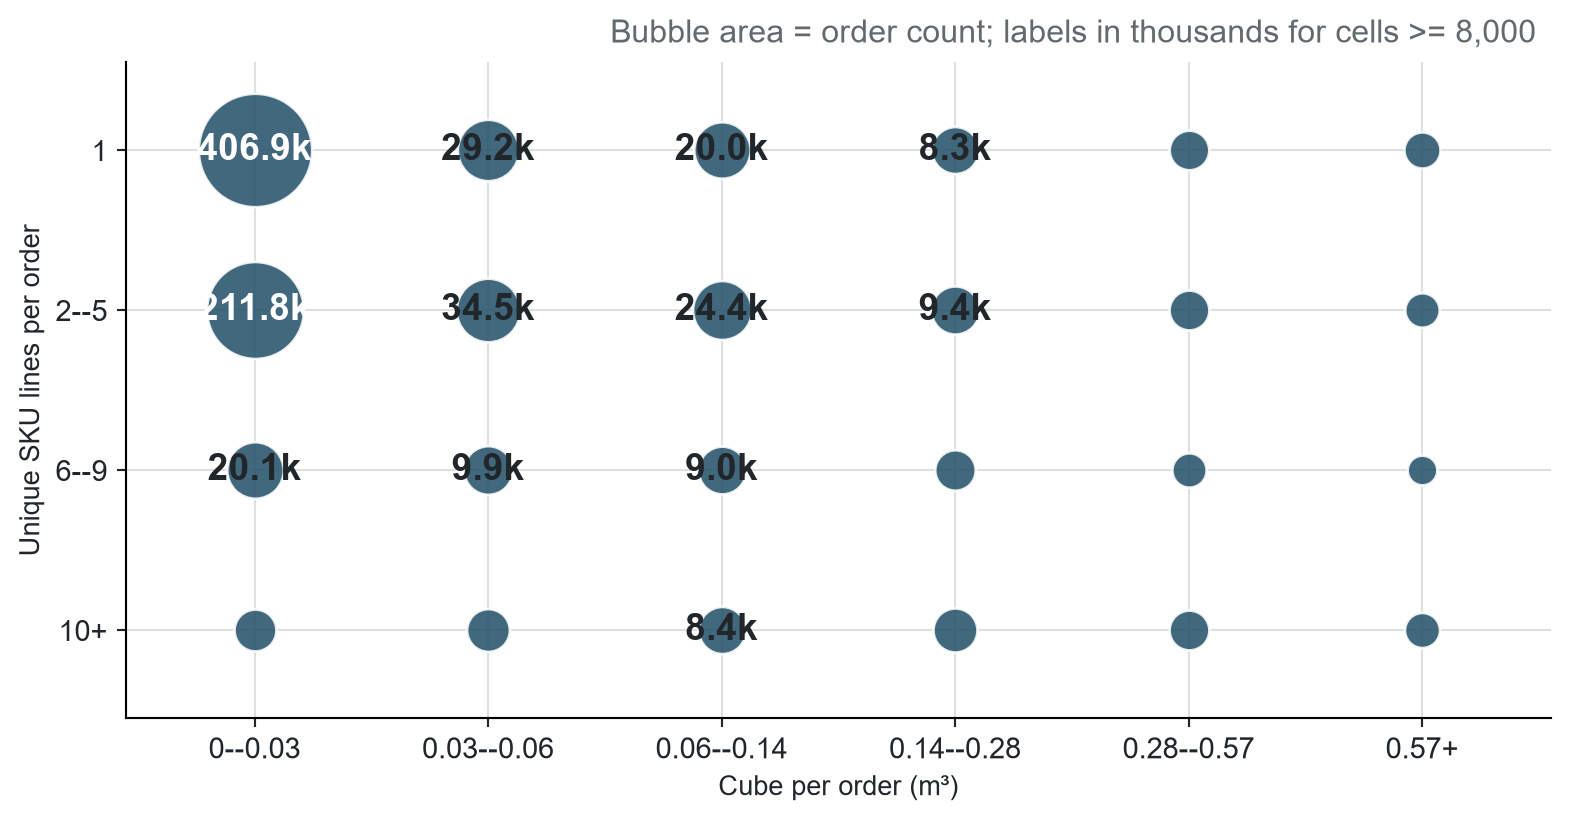
Figure 13: 49.1% of positive-cube orders contain one line and at most 0.03 m³.
Warehouse response
Route small singles to batch picking. Use carts or pallets for the large, multi-line tail.
Verified SKU mass is required before setting lift limits
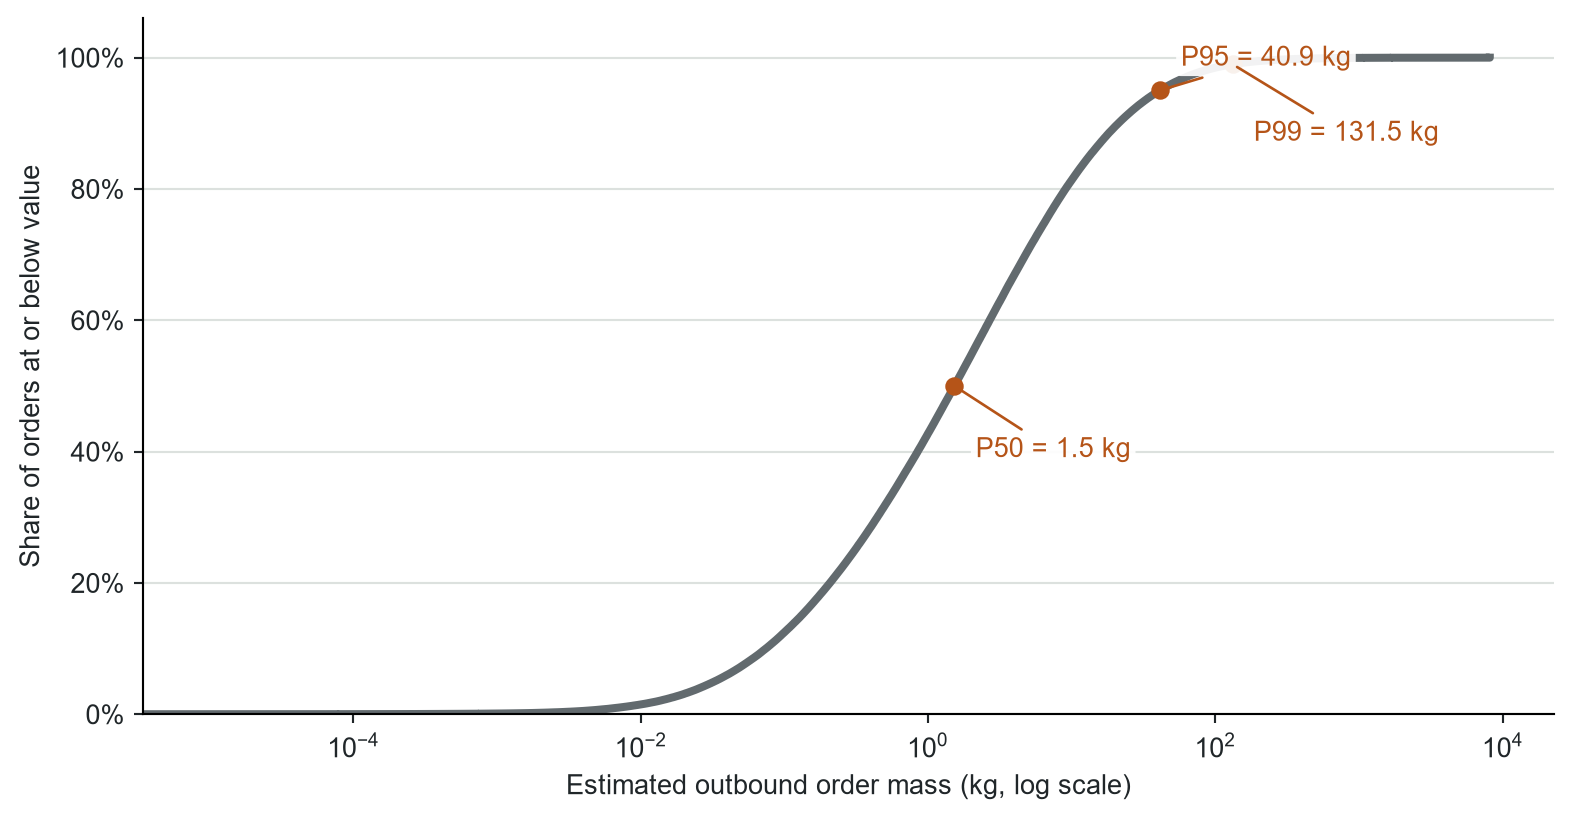
Figure 14: Positive-cube scenario: median 1.5 kg; 95th percentile 40.9 kg.
Warehouse response
Load verified SKU gross mass before setting manual-lift, cart, conveyor, or pallet thresholds.
Scenario basis: fixed product density; the source item table has no mass.
January is the 2004 high point
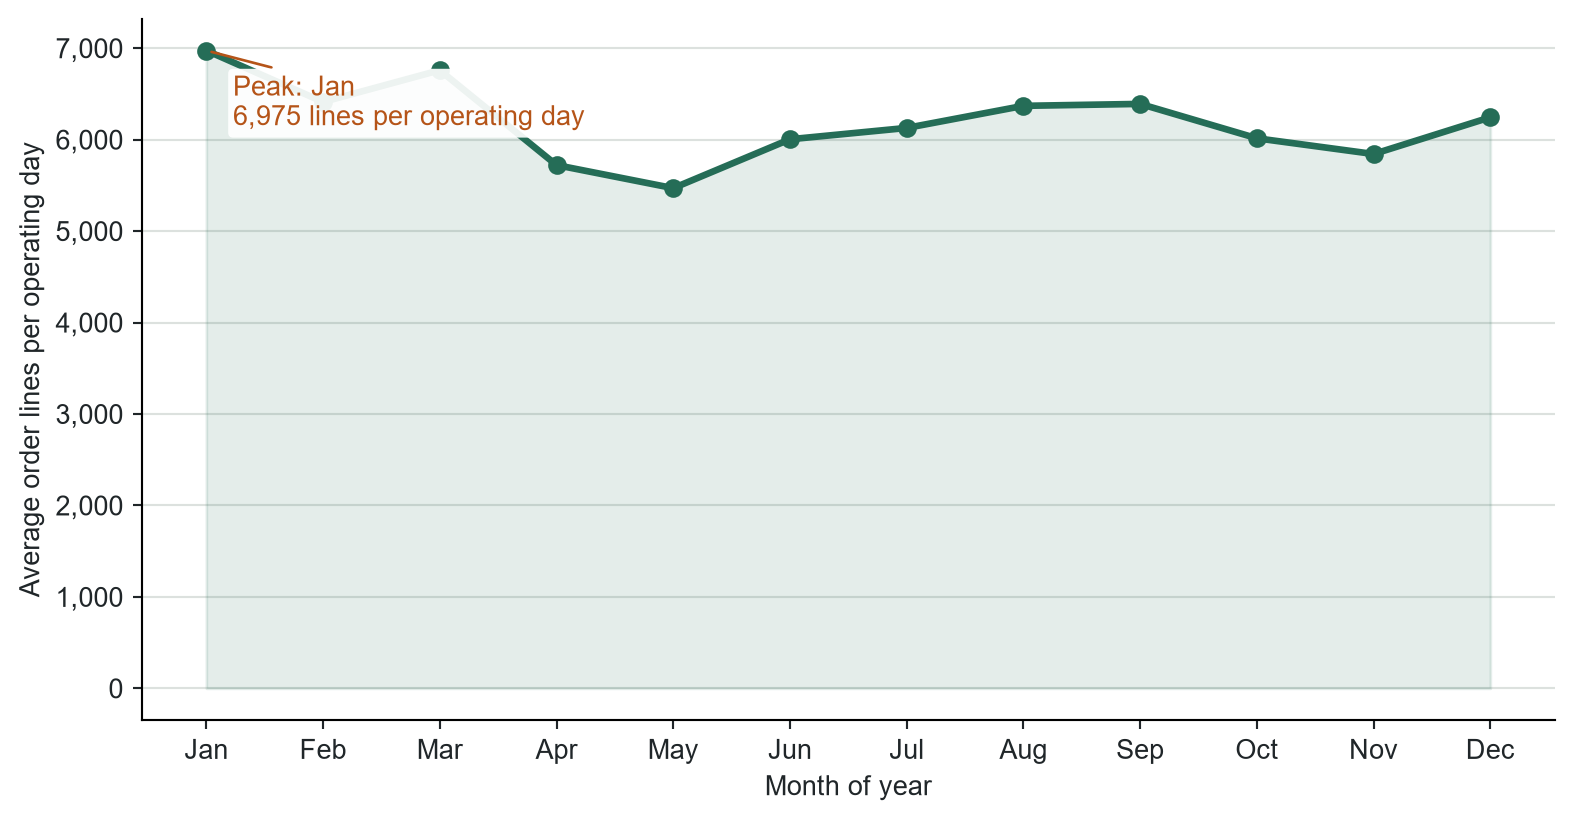
Figure 15: January averages 6,975 lines per recorded operating day.
Warehouse response
Use January as a 2004 capacity scenario. Confirm the pattern across years and after isolating calendar products before changing resources.
Days 8–14 form the monthly high point
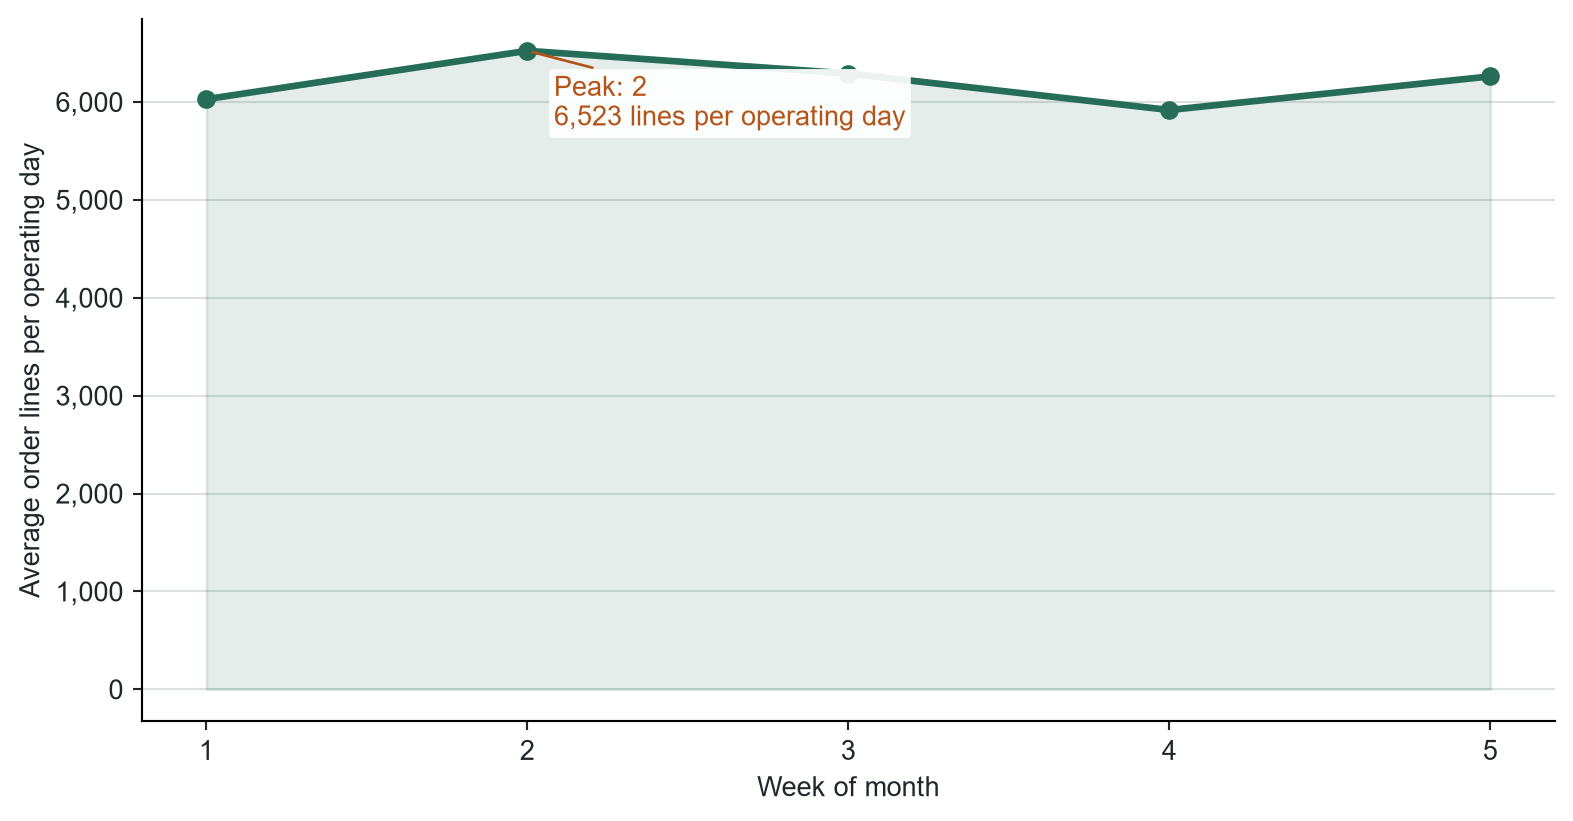
Figure 16: Order-activity proxy: days 8–14 average 6,523 lines per recorded operating day.
Warehouse response
Test whether release capacity must change during days 8–14. Confirm the pattern with WMS task and shipment events before changing labor or carrier appointments.
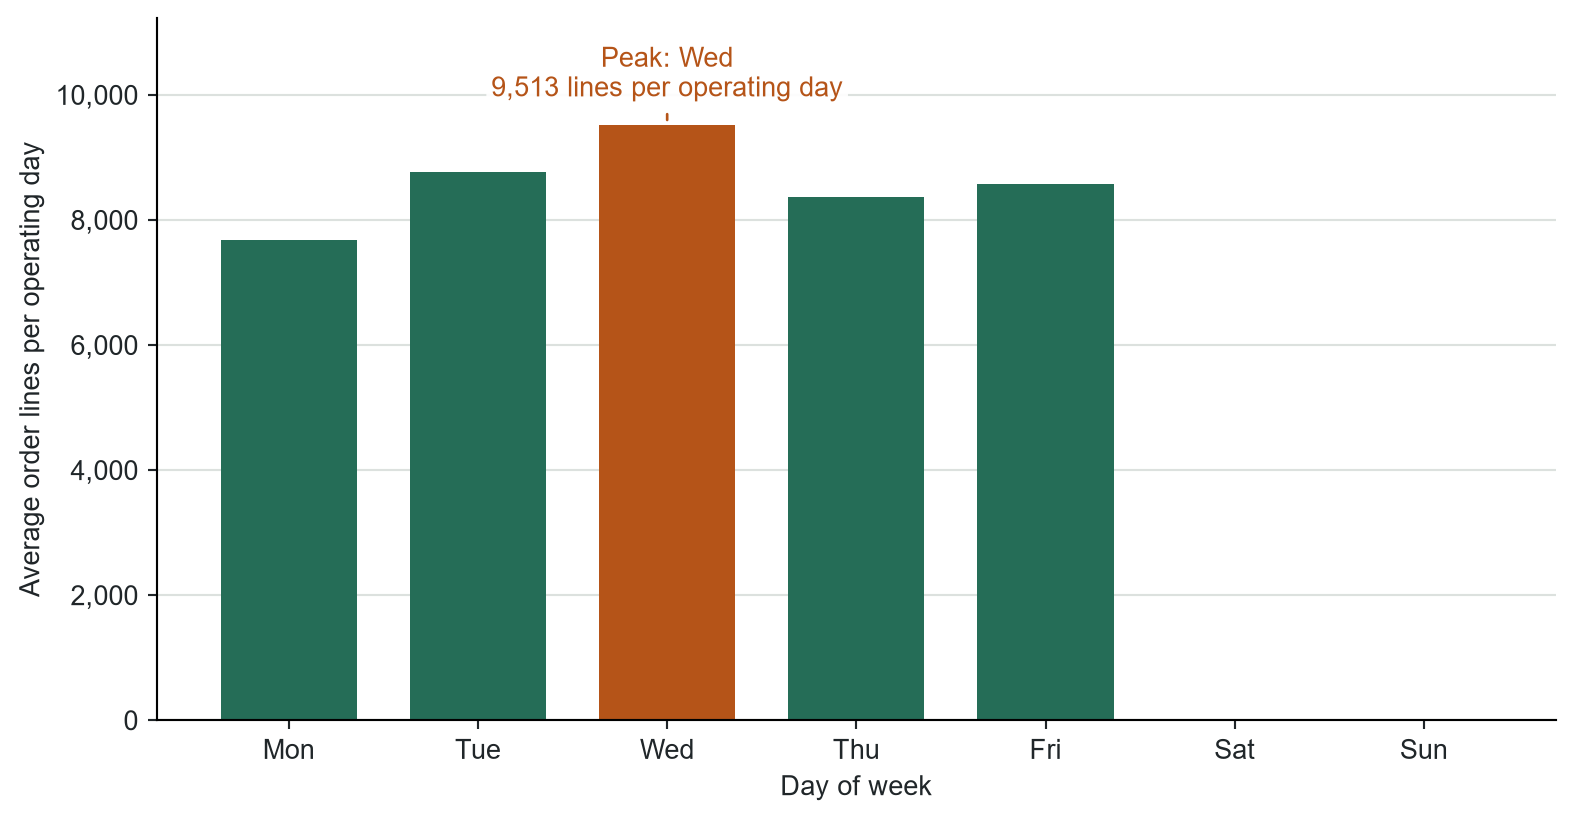
Wednesday carries the weekly peak
Figure 17: Order-activity proxy: Wednesday averages 9,513 lines per recorded operating day.
Warehouse response
Test weekday release capacity first. Confirm the pattern with pick, pack, replenishment, and shipment events before changing shifts or equipment.
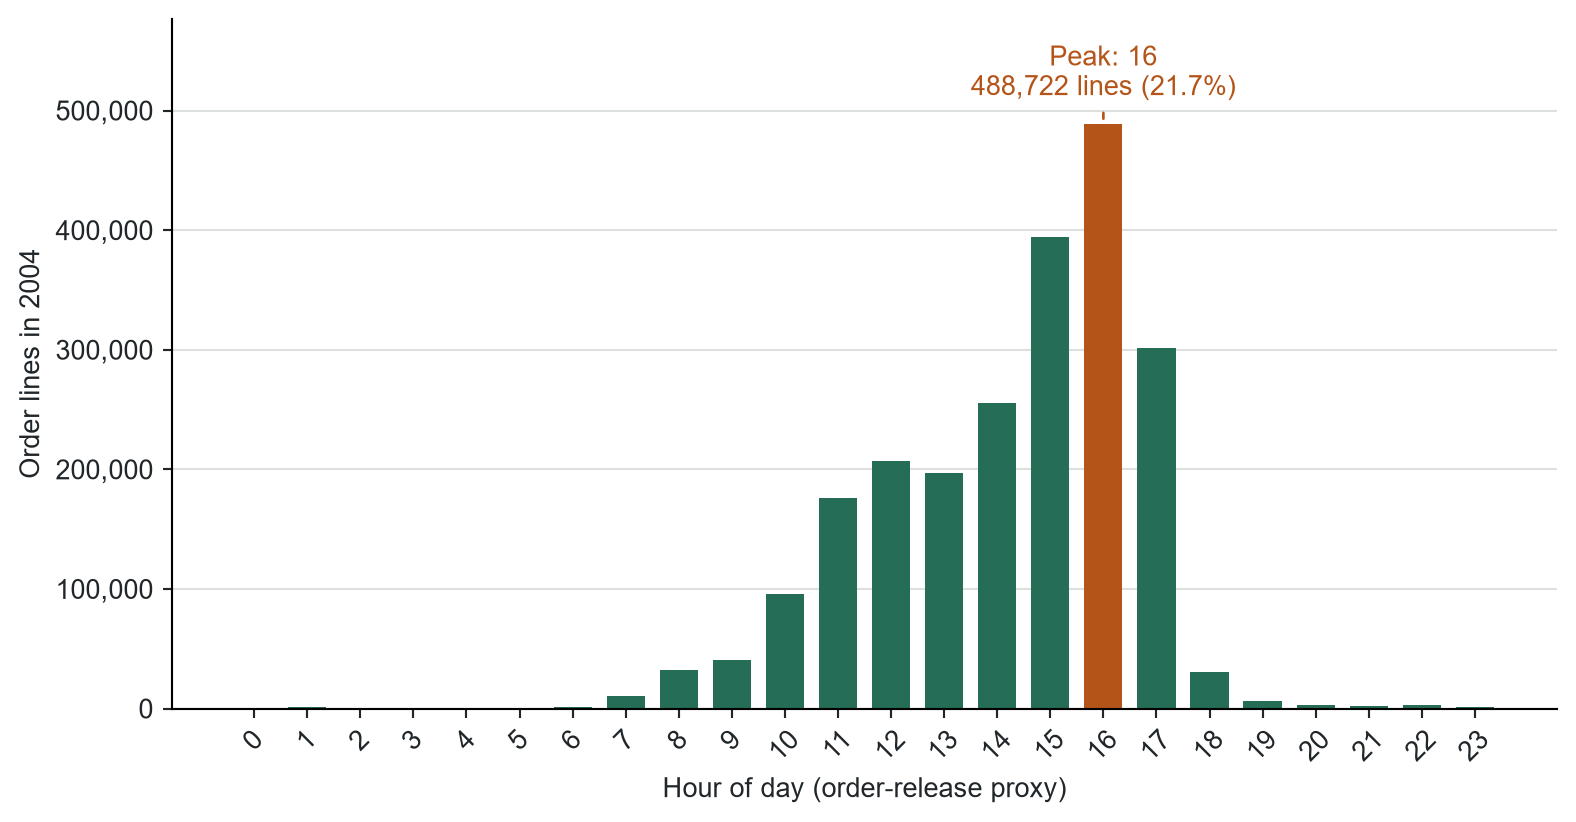
The 16:00 release peak contains 21.7% of lines
Figure 18: 16:00: 488,722 lines, or 21.7% of 2004 activity.
Warehouse response
Protect wave-release, picking, packing, and staging capacity near the 16:00 cutoff.
Order timestamps indicate release demand; WMS task scans determine labor.
Purchase order profiles
04
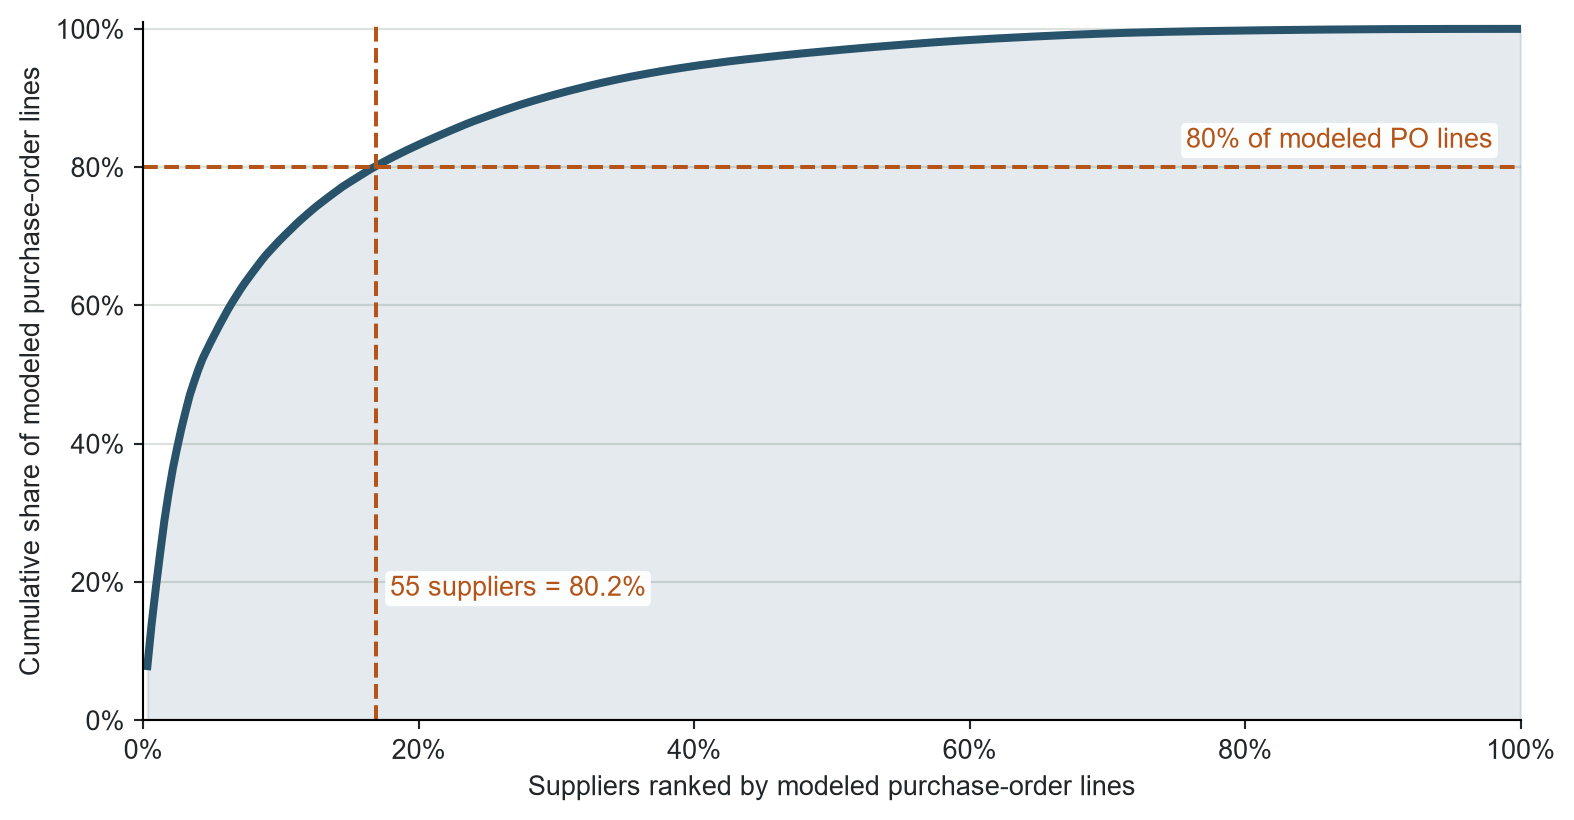
55 suppliers generate 80.2% of modeled PO lines
Figure 19: Scenario: 55 of 325 suppliers generate 80.2% of purchase-order lines.
Warehouse response
Collect ASN, receipt, discrepancy, and putaway data for the 55 dominant suppliers first.
Scenario basis: weekly supplier demand; no observed receipts.
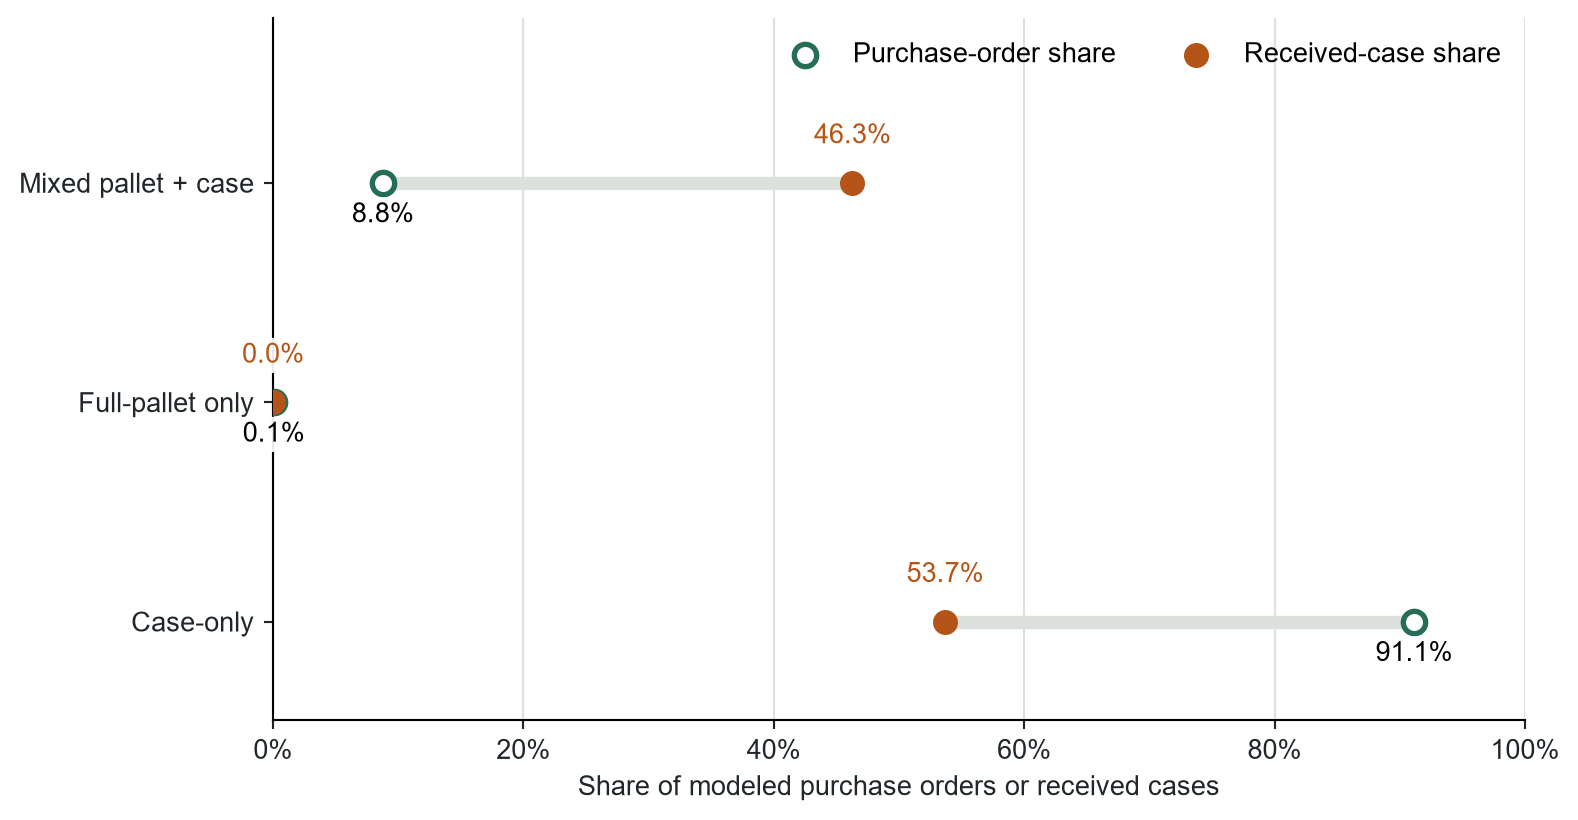
8.8% of receipts carry 46.3% of modeled cases
Figure 20: Scenario: mixed receipts are 8.8% of POs and carry 46.3% of cases.
Warehouse response
Use case receiving as the standard path and test a high-throughput mixed lane for the volume-heavy minority.
Scenario basis: weekly supplier demand and modeled pallet capacity.
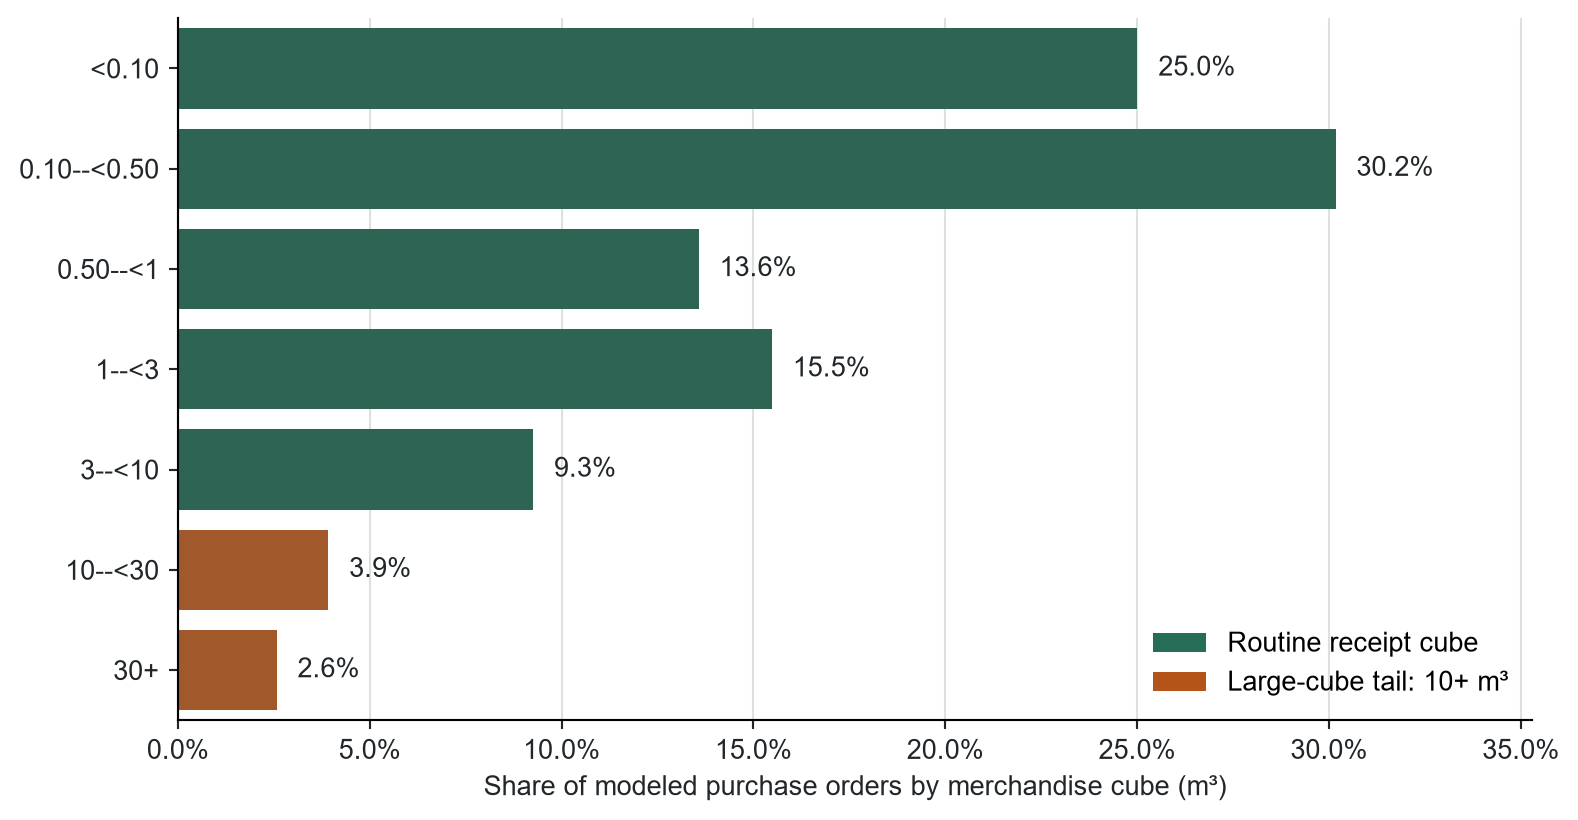
6.5% of modeled POs exceed 10 m³
Figure 21: Scenario: median PO cube is 0.37 m³; 6.5% of POs carry at least 10 m³.
Warehouse response
Route compact receipts through standard verification and reserve staging for the large-cube tail.
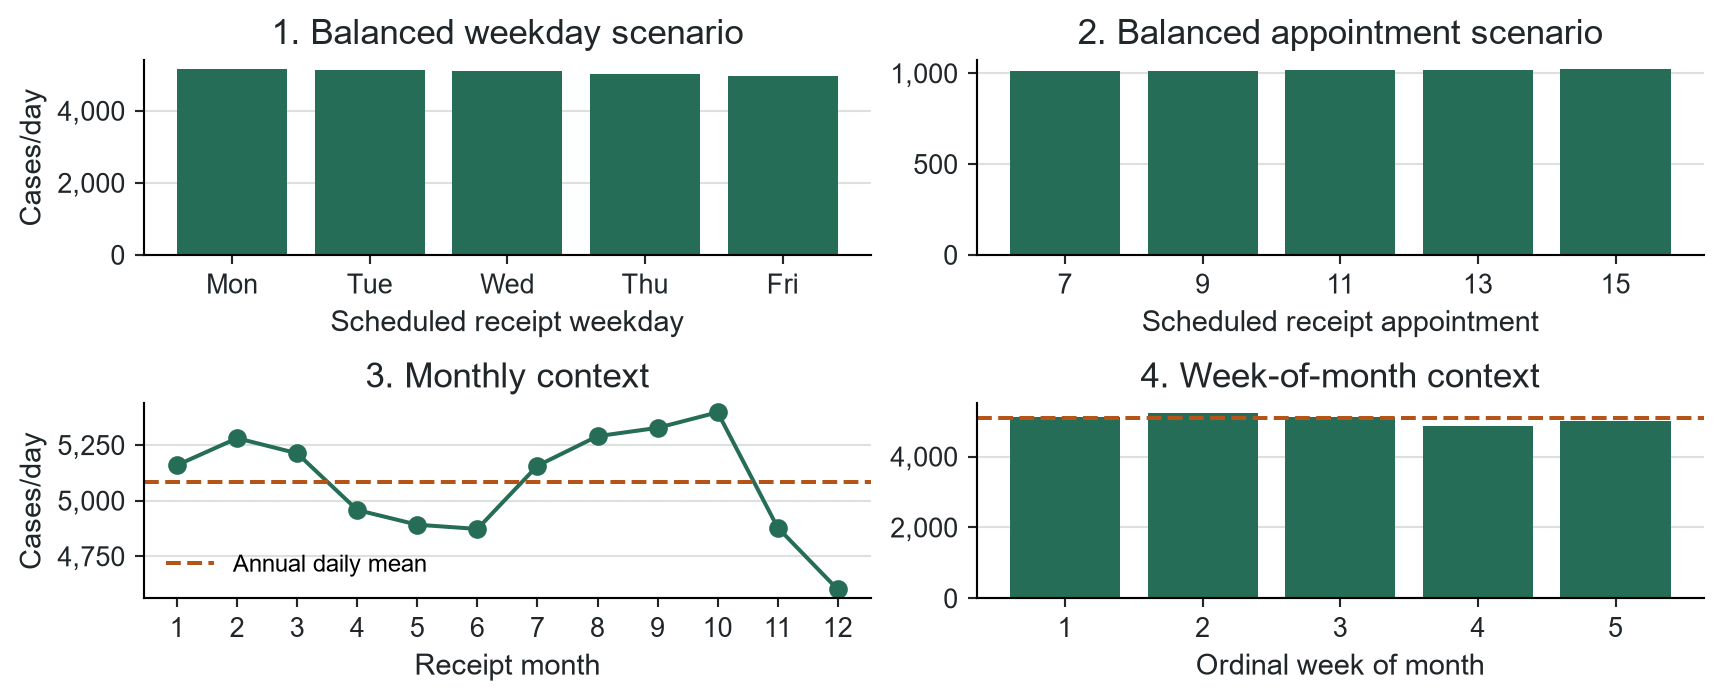
Balanced appointments keep weekday shares near 20%
Figure 22: Leveled scenario: weekday and appointment shares remain near 20%; daily P95 is 7,083 cases.
Capacity evidence: Appointment, dock-event, receipt, and putaway records.
Item activity profiles
05
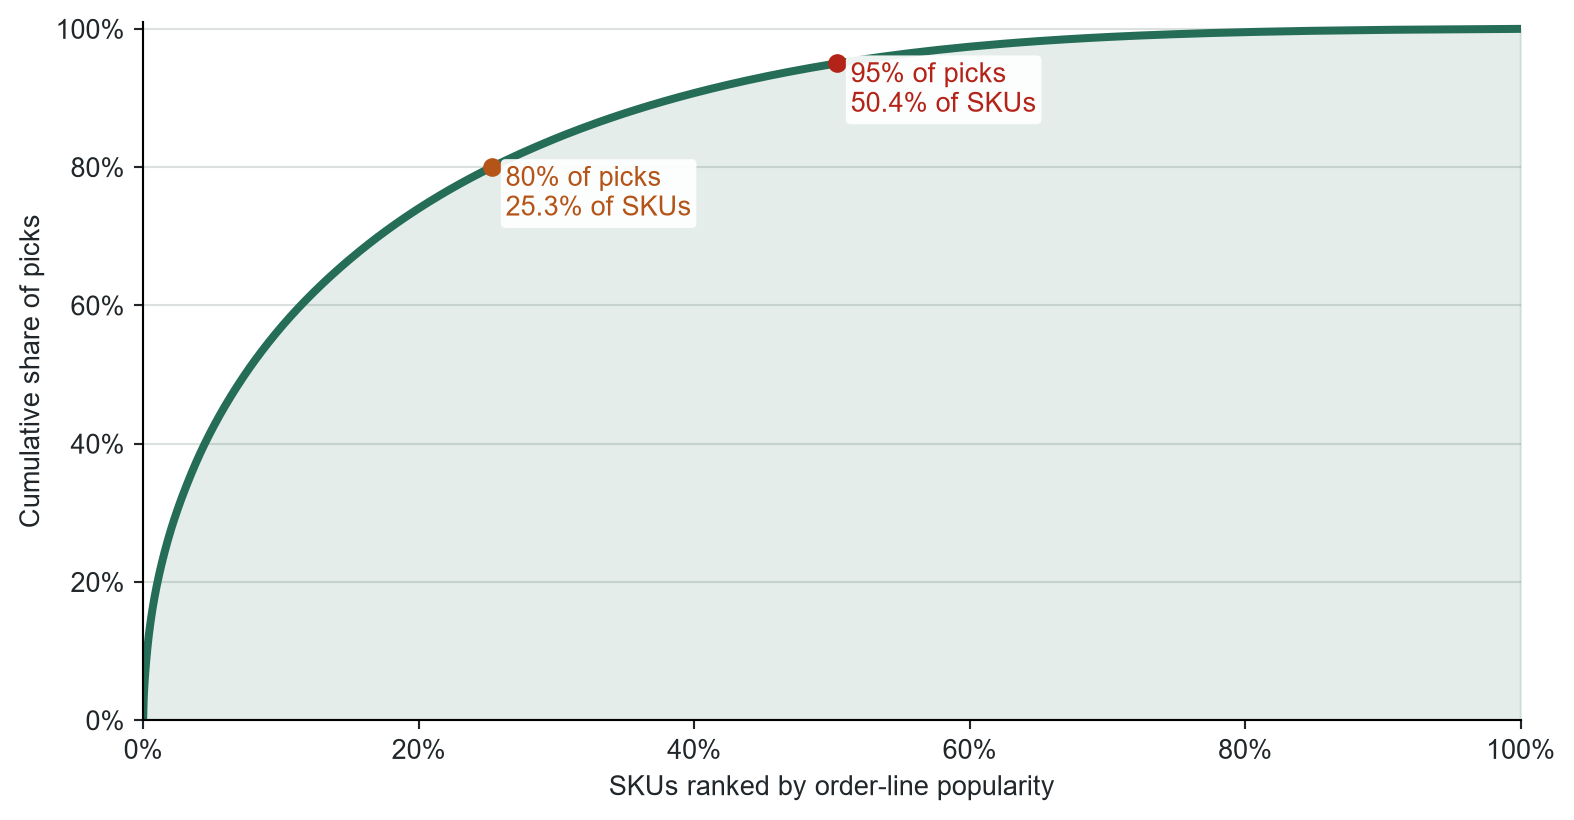
25.3% of SKUs generate 80% of picks
Figure 23: The top 7,955 SKUs generate 80% of all order-line picks.
Warehouse response
Give the 7,955 A items productive storage modes and accessible positions, then size their faces with cube, inventory, and replenishment data.
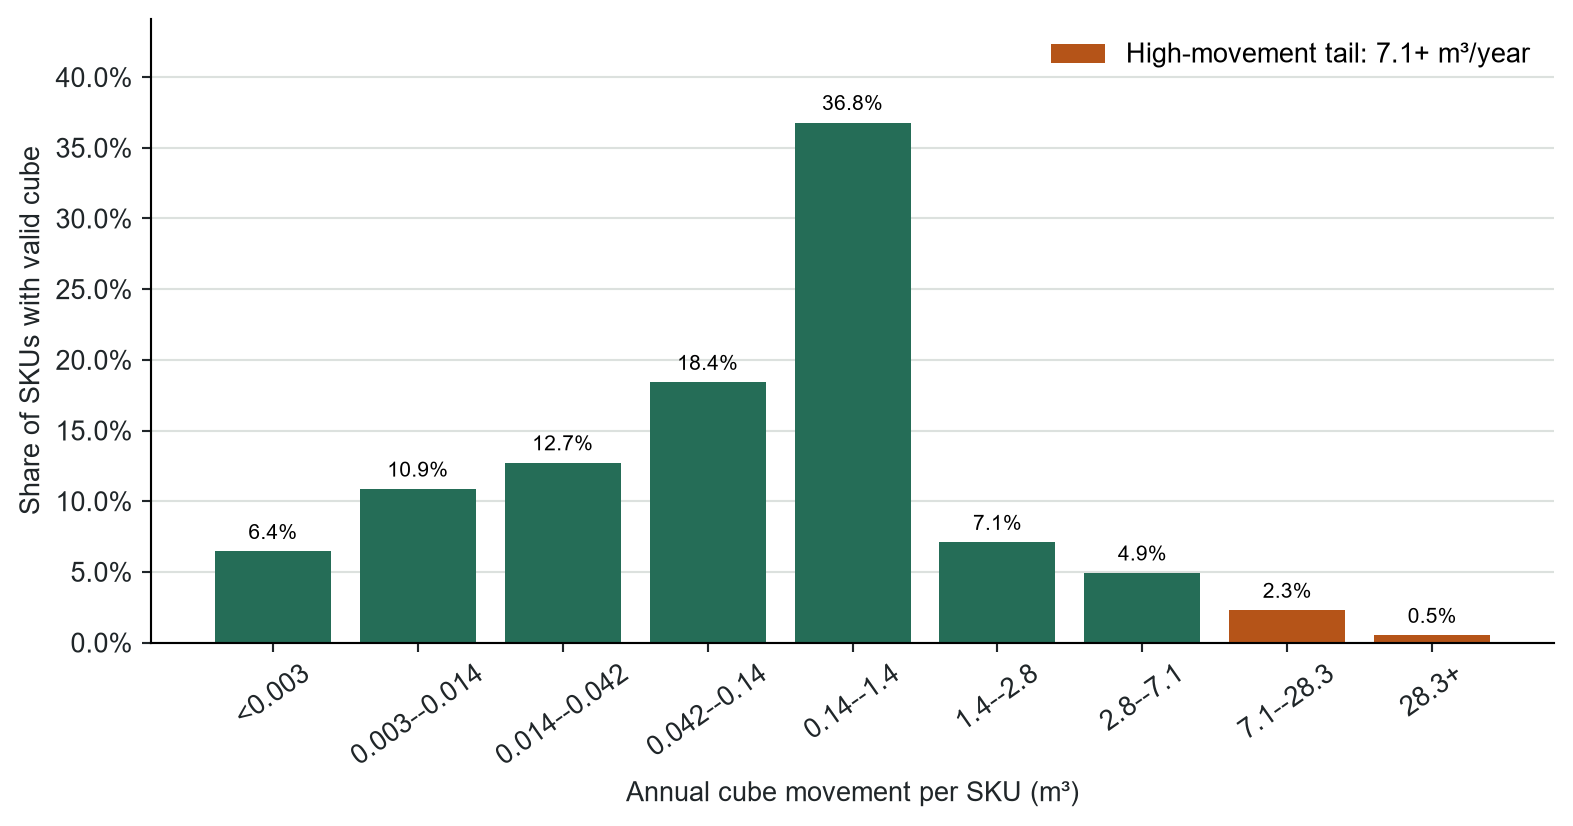
SKU cube movement spans five orders of magnitude
Figure 24: 24,283 positive-cube SKUs cover 97.3% of order lines; median movement is 0.154 m³.
Warehouse response
Screen low-cube movers for drawers or shelving and high-cube movers for larger, replenishment-friendly faces.
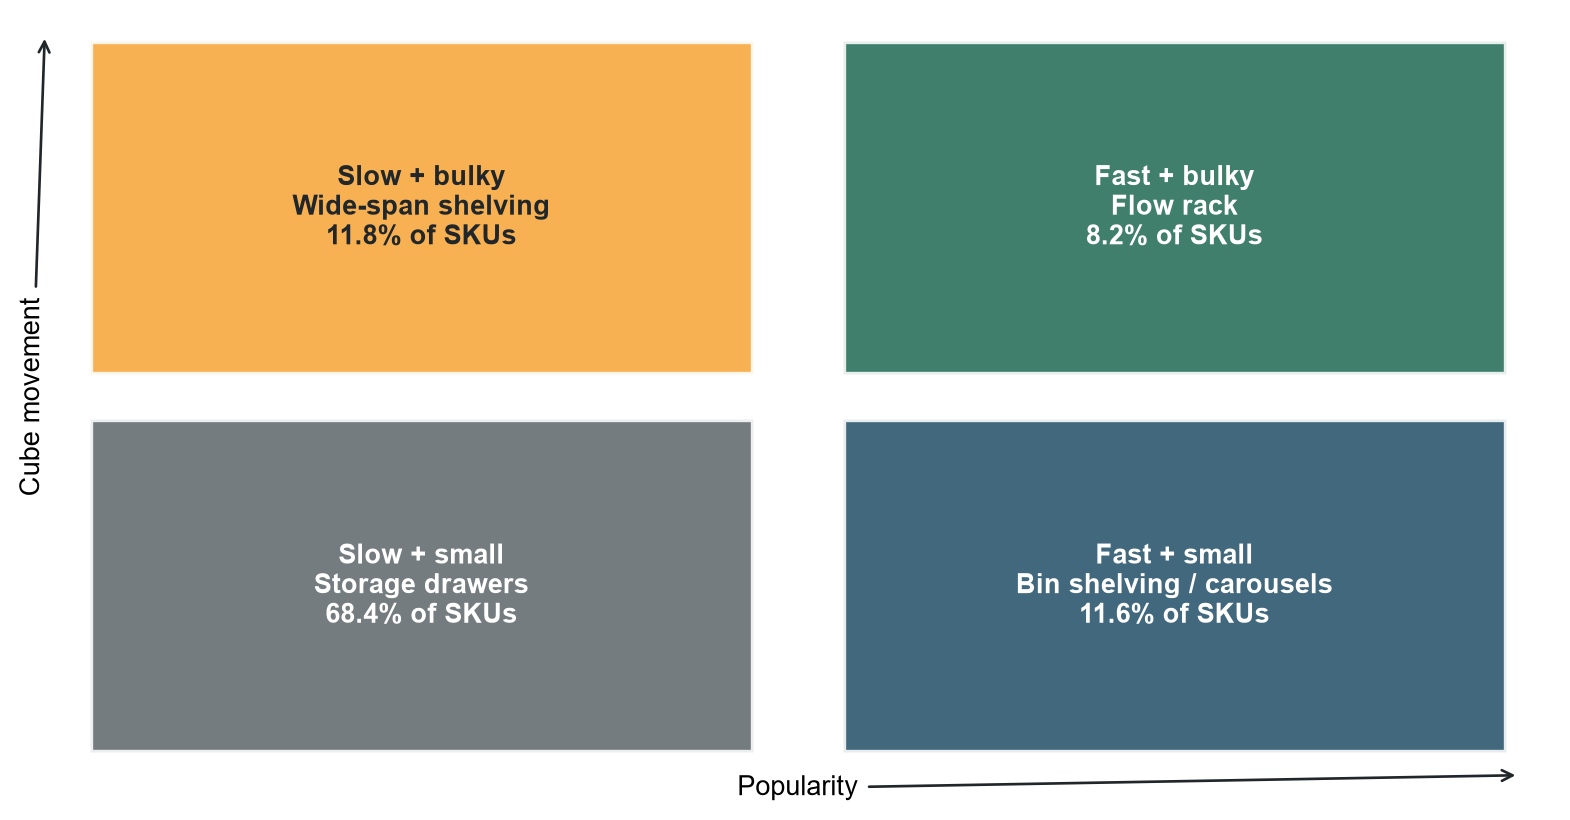
8.2% of valid SKUs are both fast and bulky
Figure 25: 8.2% of valid SKUs exceed both 80th-percentile activity guides.
Warehouse response
Separate small fast movers from bulky high-throughput items before assigning storage modes and face sizes.
Popularity and cube require different storage responses
Table 8: Storage and picking-method screening from the popularity–cube profile.
Popularity
Cube movement
Candidate warehouse response
High
Low
Ergonomic forward pick, small face, frequent replenishment
High
High
High-throughput flow storage with carefully sized reserve
Low
Low
Dense shelving, drawers, or shared low-cost storage
Low
High
Large face or reserve-oriented storage with selective access
Match storage response to activity
Storage rule
Popularity and cube movement screen storage modes and accessible positions. Replenishment interval, inventory, compatibility, and capacity determine the face size.
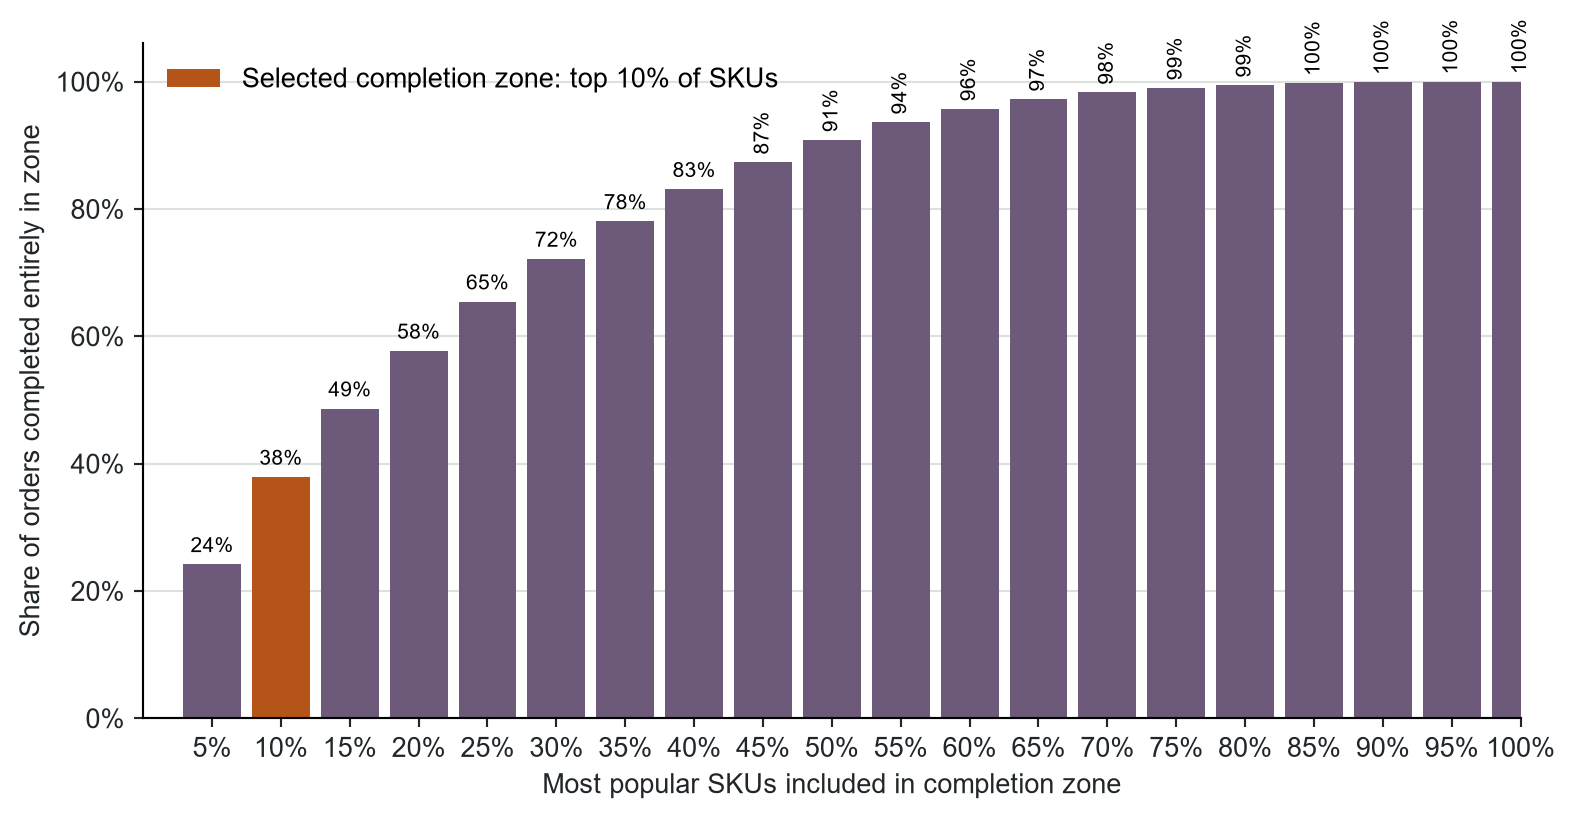
The top 10% of SKUs complete 37.9% of orders
Figure 26: The top 10% of SKUs can complete 37.9% of all orders.
Warehouse response
Test a compact order-completion zone for the top 10% of SKUs, with explicit replenishment and mixed-order merge rules.
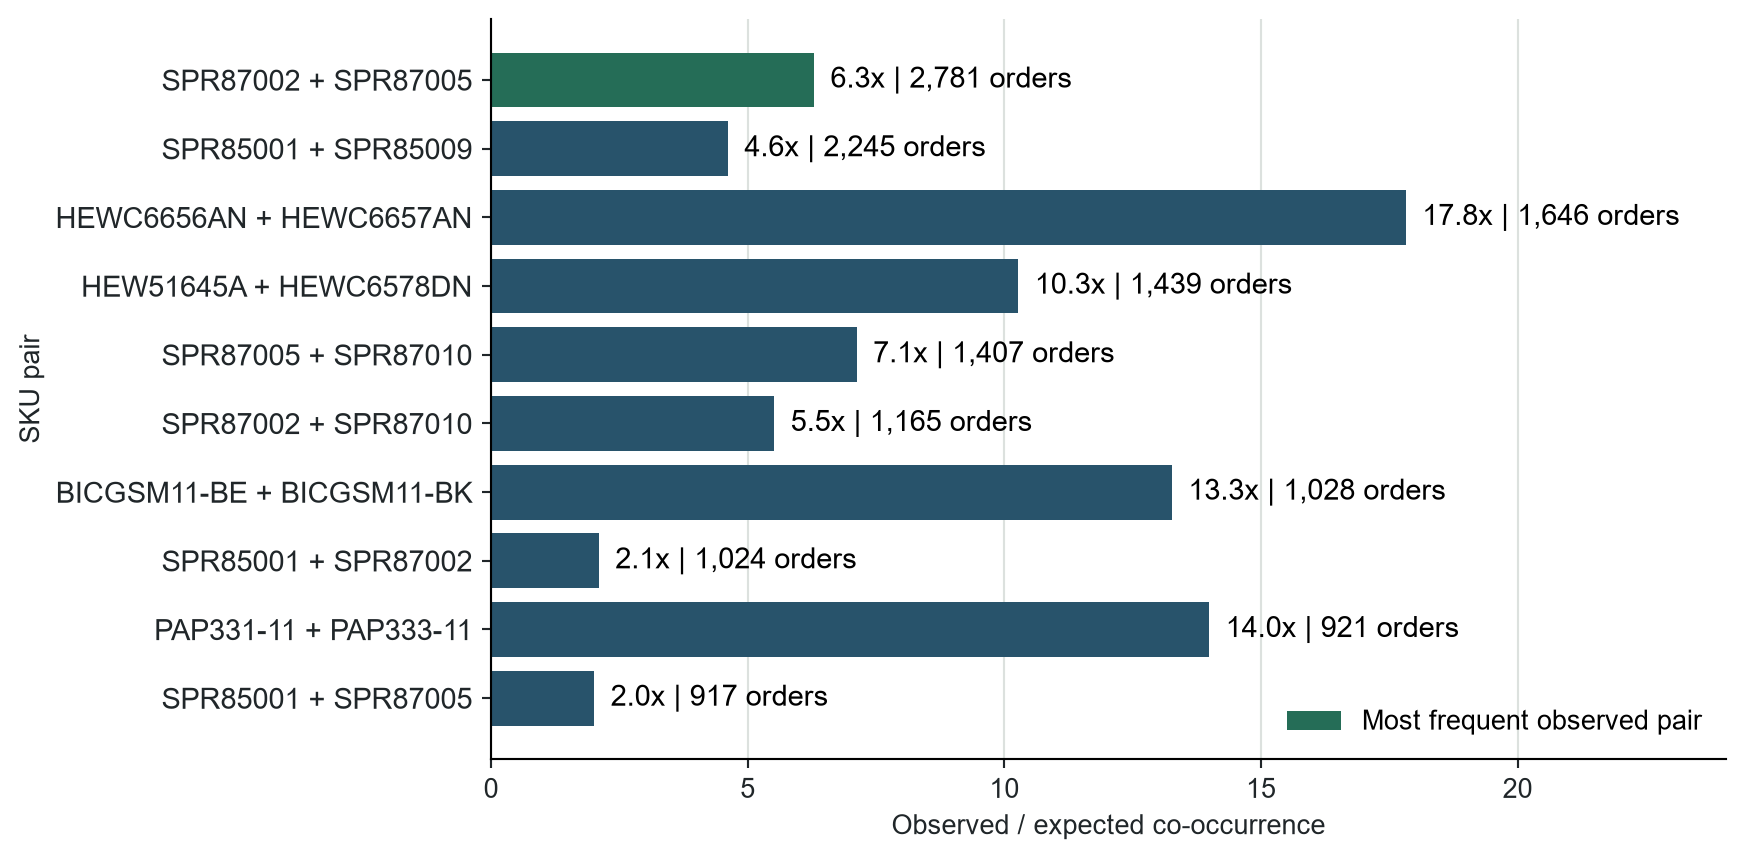
Most frequent SKU pair has 6.3x lift
Figure 27: Most frequent pair: 2,781 observed orders versus 442 expected, a 6.3x lift.
Decision: Test stable high-lift pairs only when travel savings exceed congestion and replenishment cost.
Product structure and affinity shape warehouse zones
Define handling-compatible product families.
Measure SKU-pair co-occurrence.
Compare observed pairs with an independence baseline.
Protect popular golden-zone positions.
Test tour distance, congestion, and workload balance.
Test affinity before changing zones
Apparel example
Zone by size, group styles, mix colors, place the most popular color near waist height, and spread popular sizes to control congestion.
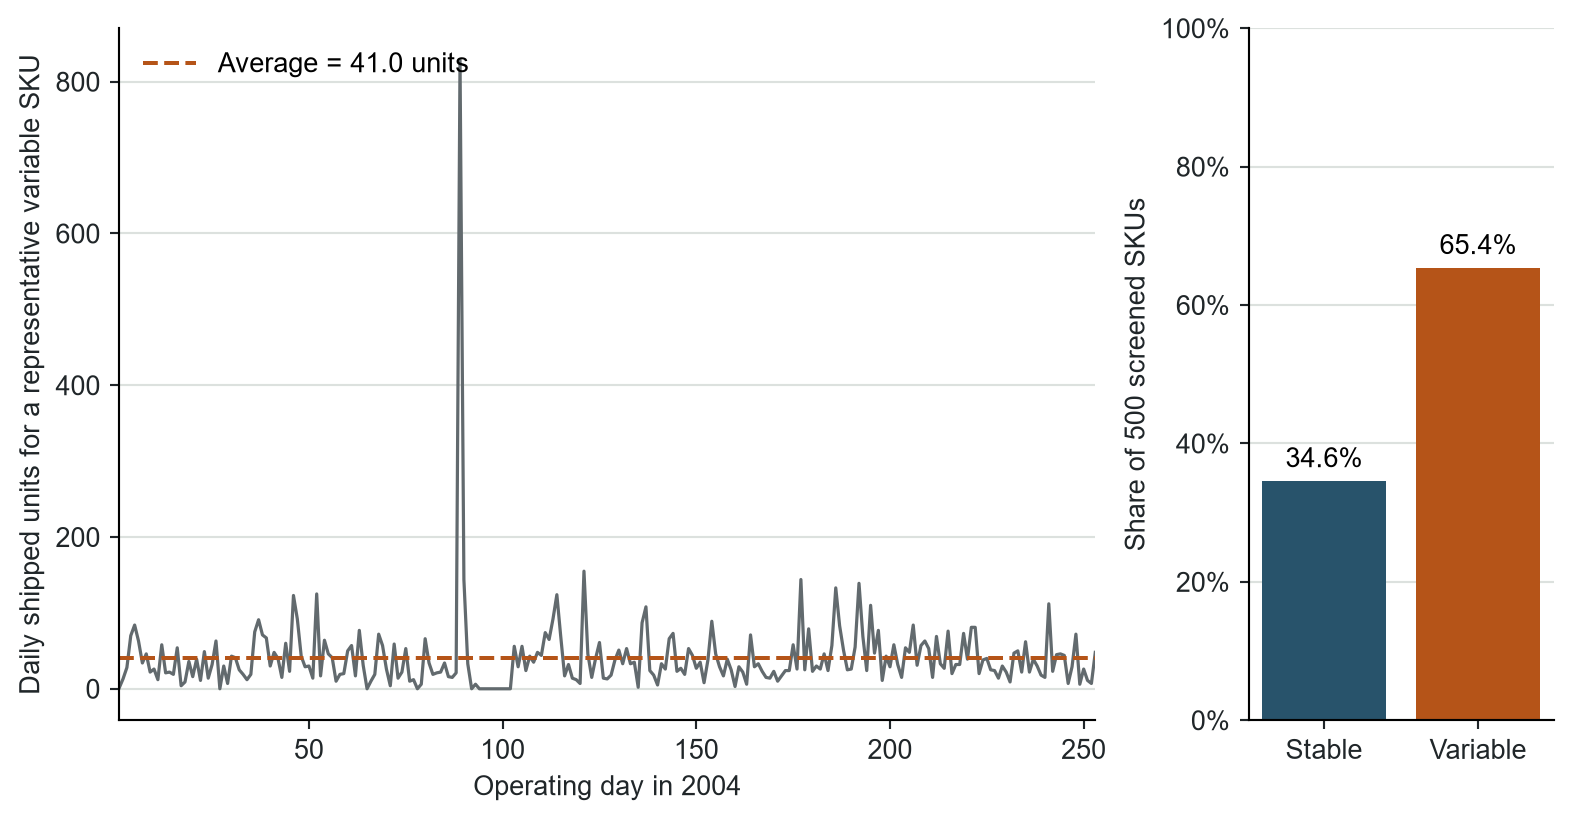
Daily variation exceeds the mean for 65.4% of SKUs
Figure 28: For 65.4% of 500 SKUs, daily standard deviation exceeds the mean.
Warehouse response
Set pick-face allowances from the replenishment interval and service target, then test the 500 active SKUs across seasonal periods.
Item inventory profiles
06
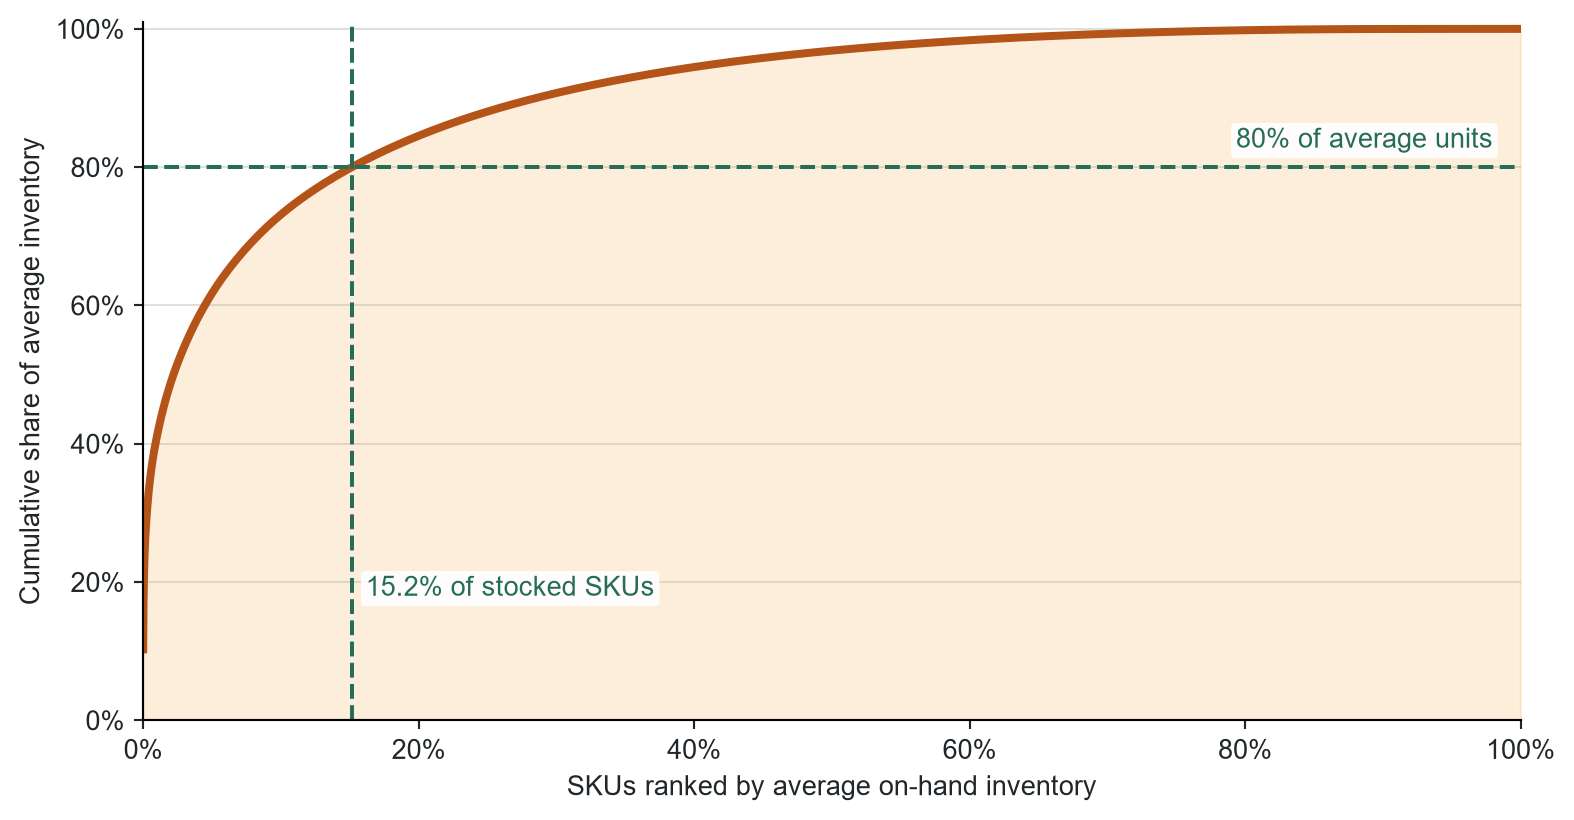
15.2% of stocked SKUs hold 80% of units
Figure 29: 4,212 stocked SKUs (15.2%) hold 80% of average selling-unit count.
Warehouse response
Review the 4,212 inventory-dominant SKUs first. Add cube, handling units, and service targets before changing storage capacity.
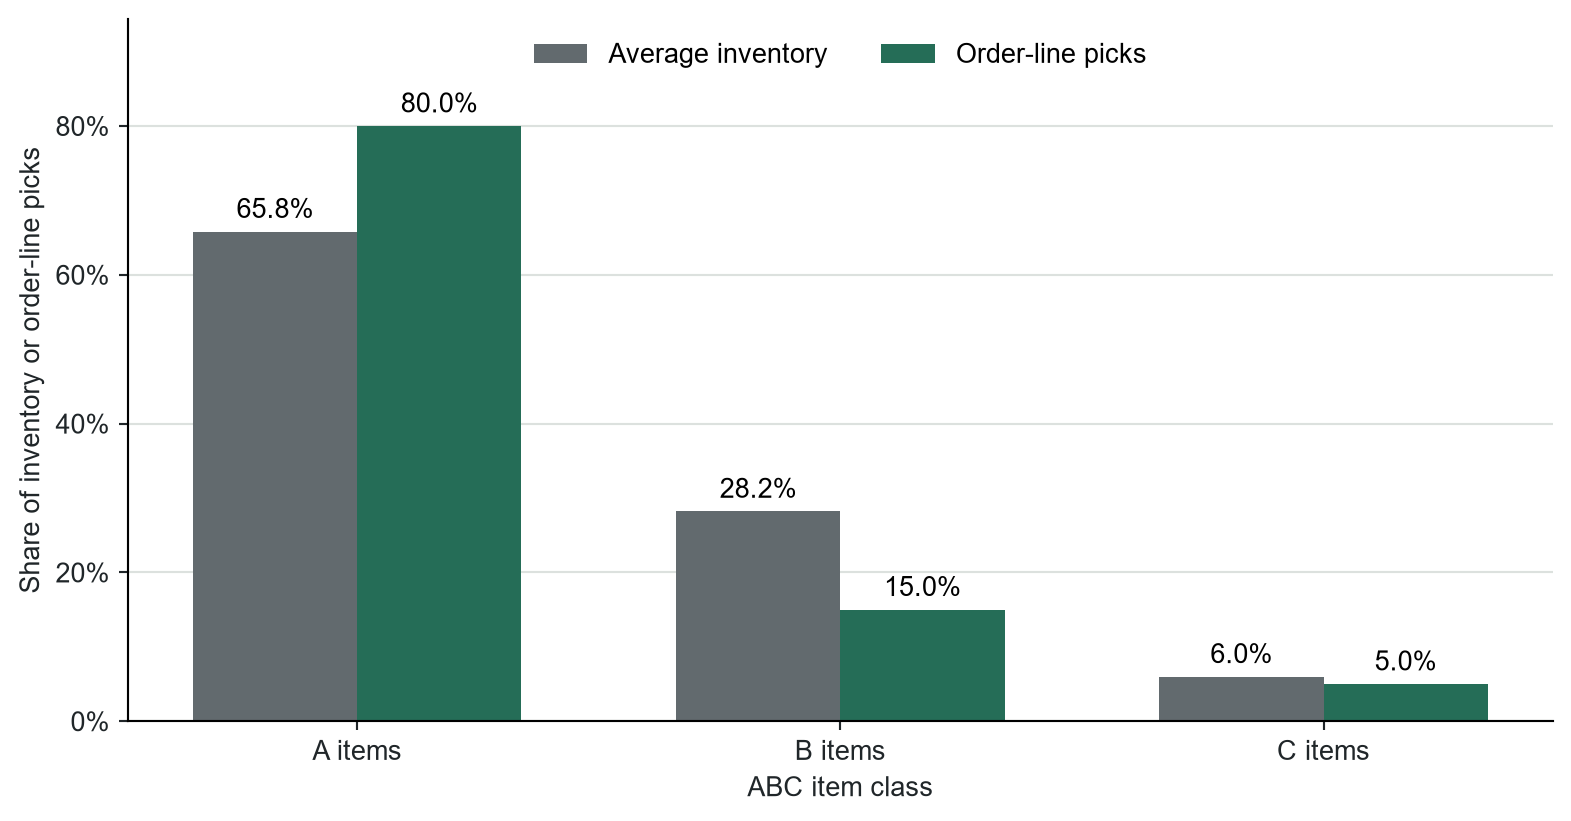
A items hold 65.8% of average selling units
Figure 30: A items generate 80% of picks and hold 65.8% of average selling-unit count.
Warehouse response
Use this unit-count screen to select SKU-level reviews. Diagnose policy with days of supply, value, lead-time demand, fill rate, and backorders.
Slow movers need explicit retention and storage rules
1. Justify retention
Check service obligations, assortment completion, contracts, lead time, and inventory age at SKU level.
2. Assign storage
Choose the least-accessible feasible storage position. Test dense reserve or batch picking against retrieval work and the service promise.
Do not infer obsolescence from class C
Use demand, inventory age, service requirement, value, and stockout evidence at SKU level before disposal or relocation.
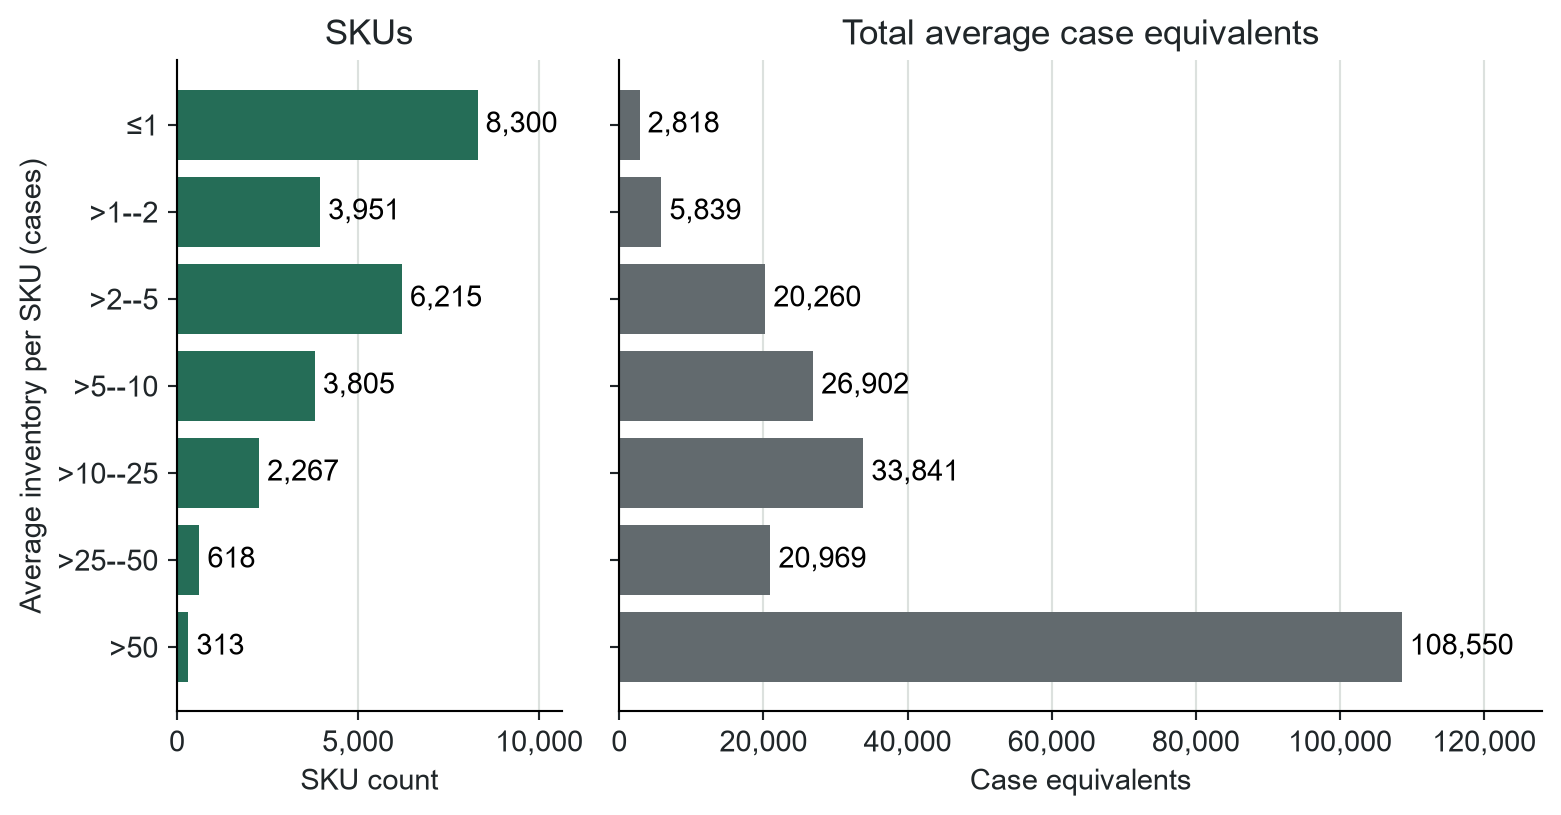
32.6% of SKUs average no more than one case
Figure 31: 8,300 SKUs (32.6%) average at most one case on hand.
Warehouse response
Screen the low-case ranges for shelving or carton flow and the higher ranges for rack, reserve, or bulk storage.
Combining profiles for warehouse decisions
07
Warehouse redesign uses profile combinations
Table 9: Profile combinations that support common warehouse redesign questions.
Redesign question
Required profile combination
Dedicated processing cell?
Customer Pareto + family mix + order completion + calendar clock
Separate case and pallet processes?
Handling mix + order increments + lines and cube per order
Which storage mode?
Popularity + cube movement + handling-unit inventory + variability
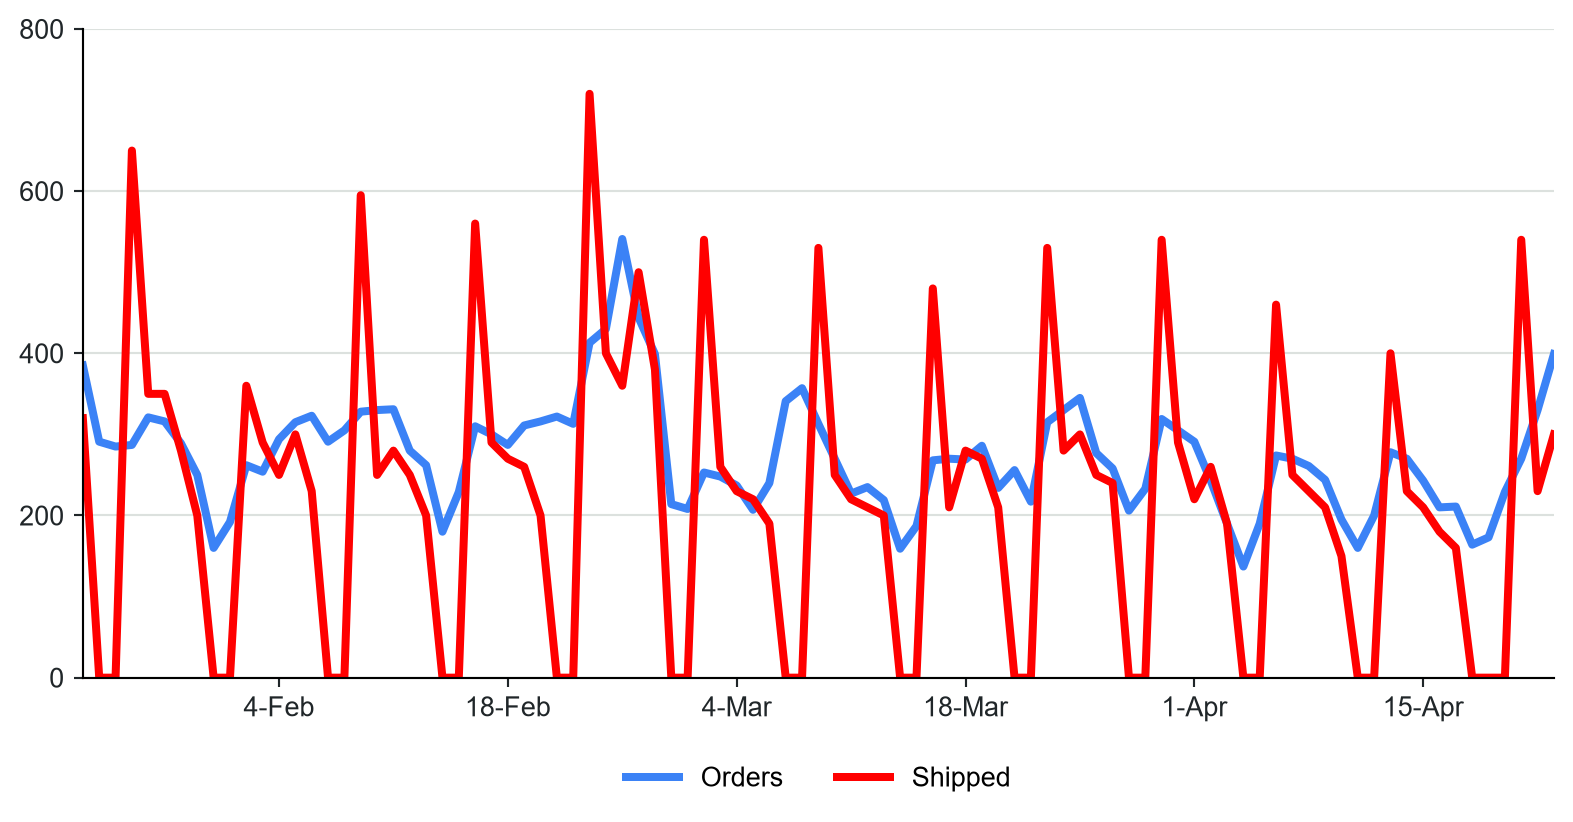
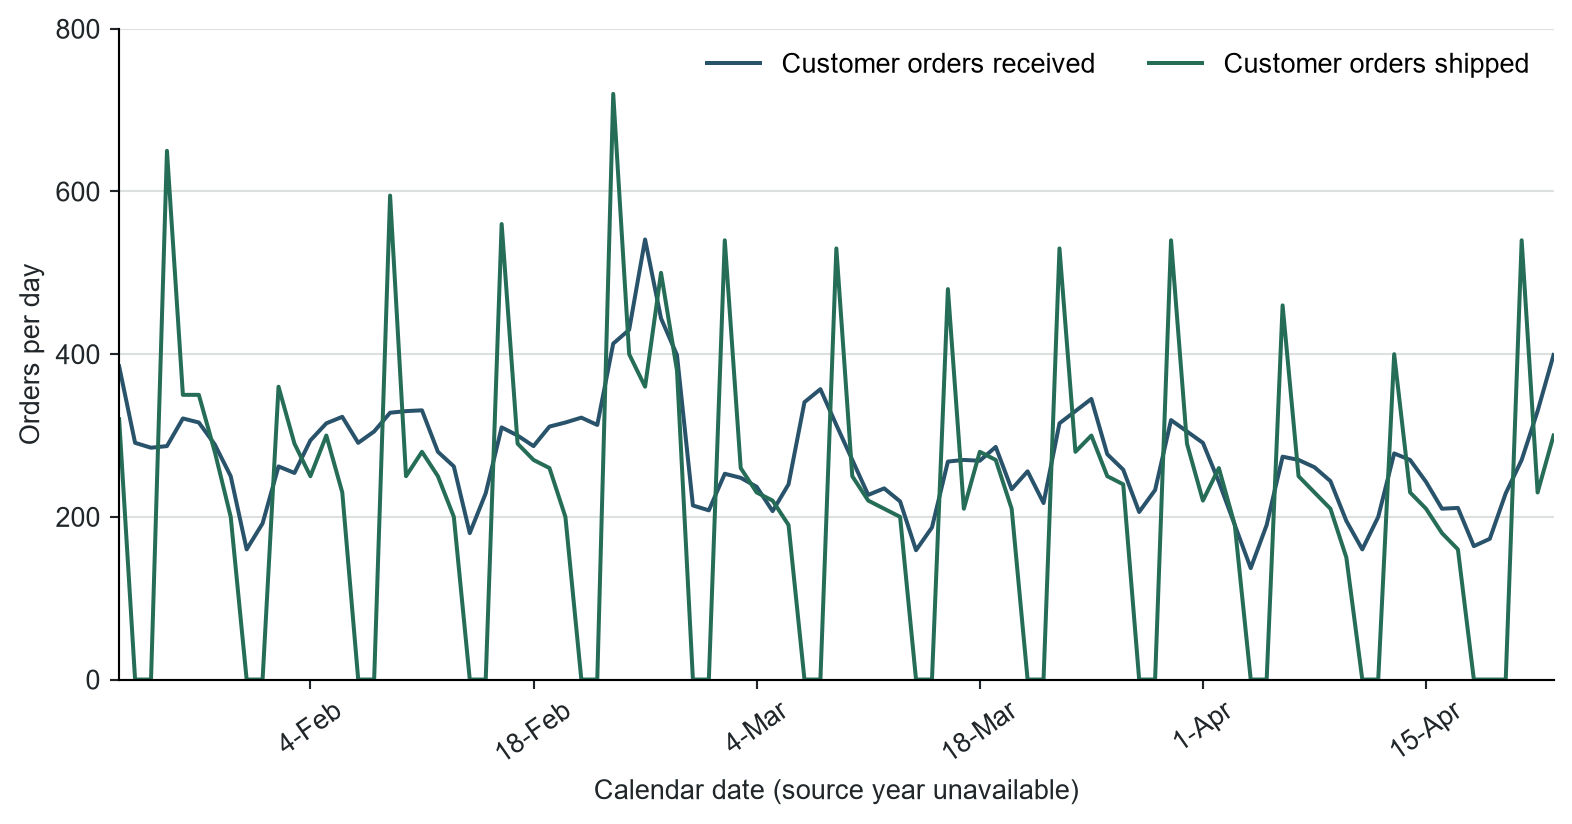
The first chart cannot support a staffing decision
Figure 32: The source chart shows dates and series, but omits the year, measure definition, population, and decision threshold.
Why it fails
“Orders” does not identify receipt, release, pick, or dispatch.
The year and exact study period are absent.
The vertical axis has no unit or population.
No capacity requirement or warehouse decision is stated.
Defined events and units expose the pattern
Figure 33: Defined warehouse events and units make the digitized daily pattern interpretable.
What changed
Define customer orders received and shipped.
State orders per calendar day.
Retain the source dates and disclose the missing year.
Preserve the same digitized values and vertical scale.
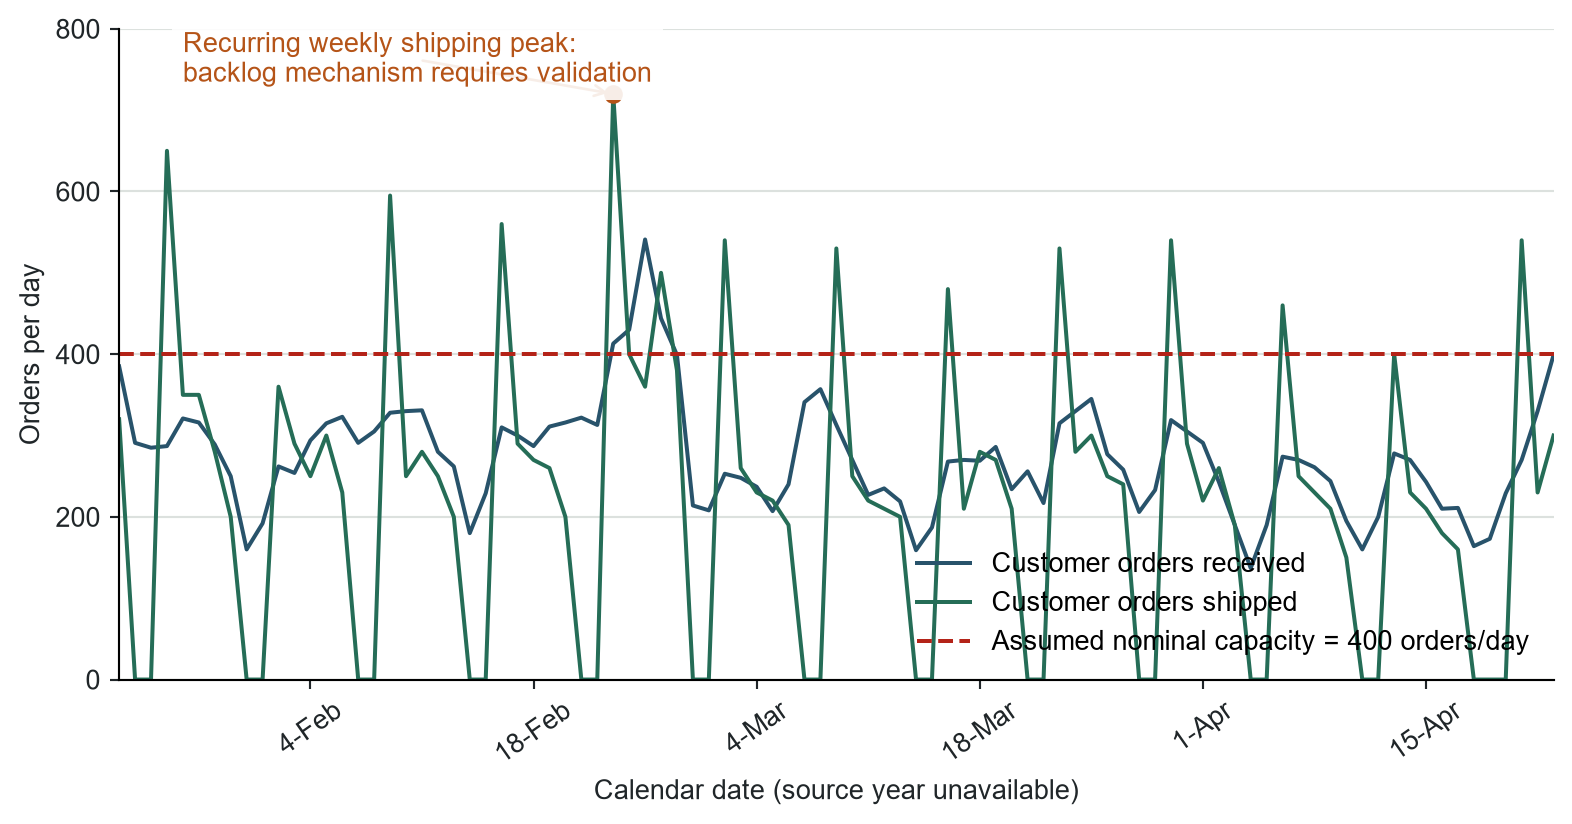
Weekly shipping peaks warrant a backlog test
Figure 34: Recurring shipping peaks exceed an assumed 400-order daily capacity; the backlog mechanism remains a hypothesis.
Warehouse response
Quantify the recurring weekly peak.
Label 400 orders/day as an assumed capacity.
Test weekend closure and backlog records.
Compare temporary staffing with release smoothing.
Repair one profile for a warehouse manager
Choose one profile and revise it in three passes:
Chart completeness: Define population, period, unit of analysis, denominator, units, legend, and thresholds.
Evidence: Quantify the dominant concentration, peak, mixture, or exception.
Improvement strategy: State one warehouse action and the assumption that must be validated.
Manager test
Hide the report text. Can a warehouse manager understand the evidence and decision from the title, figure, caption, and warehouse-response box?
Present a checked profile in five parts
Decision: Name the warehouse choice the profile informs.
Unit: Define the observation, period, numerator, denominator, and unit.
Distribution: Show the full pattern with readable labels and scale.
Finding: Quantify the concentration, mix, scale, timing, or exception.
Test: Compare one warehouse change using service, capacity, travel, and cost.
Final check
A warehouse manager should understand the observed work, the proposed change, and the evidence still required.
References
Sources cited in this deck
Baker, Peter, and Marco Canessa. 2009. “Warehouse Design: A Structured Approach.”European Journal of Operational Research 193 (2): 425–36. https://doi.org/10.1016/j.ejor.2007.11.045.
Bartholdi, John J., and Steven T. Hackman. 2019. Warehouse
& Distribution Science. Release 0.98.1. The Supply Chain
& Logistics Institute, Georgia Tech. https://doi.org/10.13140/RG.2.1.4264.0481.
Brin, Sergey, Rajeev Motwani, and Craig Silverstein. 1997. “Beyond Market Baskets: Generalizing Association Rules to Correlations.”Proceedings of the 1997 ACM SIGMOD International Conference on Management of Data (New York, New York, USA), 265–76. https://doi.org/10.1145/253260.253327.
Frazelle, Edward. 2016. World-Class Warehousing and Material Handling. Second Edition. McGraw-Hill Education.
Medrano-Zarazúa, Lucy, Jania Astrid Saucedo-Martínez, and Johanna Bolaños-Zuñiga. 2024. “Storage Location Assignment Problem in a Warehouse: A Literature Review.” In Computer Science and Engineering in Health Services, edited by José Antonio Marmolejo-Saucedo, Roman Rodríguez-Aguilar, Pandian Vasant, Igor Litvinchev, and Brenda M. Retana-Blanco. Springer International Publishing. https://doi.org/10.1007/978-3-031-34750-4_2.
Reyes, Juan José Rojas, Elyn Lizeth Solano-Charris, and Jairo Rafael Montoya-Torres. 2019. “The Storage Location Assignment Problem: A Literature Review.”International Journal of Industrial Engineering Computations, 199–224. https://doi.org/10.5267/j.ijiec.2018.8.001.