Facility requirements
Facility requirement considerations (Tompkins 2010):
- Space requirements
- storage systems
- material handling equipment
- office, cafeteria, restroom, etc.
- Flow systems
- Movement of goods, materials, energy, information, and/or people.
- Activity relationships
- Useful to measure flow
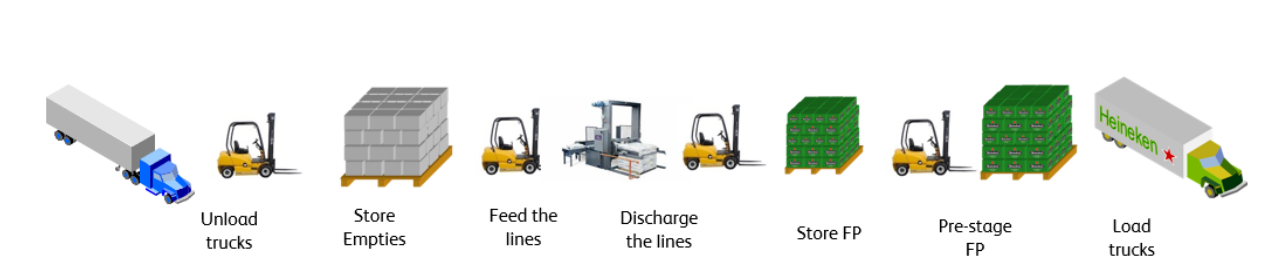
Figure 1: Example of internal flow in Heineken’s brewery. The process begins with “unload trucks,” where trucks with empties are discharged using forklifts. Next, “store empties” involves moving empties to the empty yard for storage. “Feed the lines” transfers empty bottles to production lines for filling. The “discharge the lines” step moves finished products (FP) to storage locations, followed by “pre-stage FP” to prepare orders for efficient truck loading. Finally, “load trucks” completes the process by loading FP into trucks for client delivery. Each step involves transportation and handling activities (Aussaresse 2023).
Short-lived high peak-to-average storage ratio
Outside warehousing and/or trailer storage should be considered to accommodate the peak storage requirement if:
- the duration of the peak is short-lived (<0.5 year), and
- the peak-to-average storage ratio is high (> 1:5), then
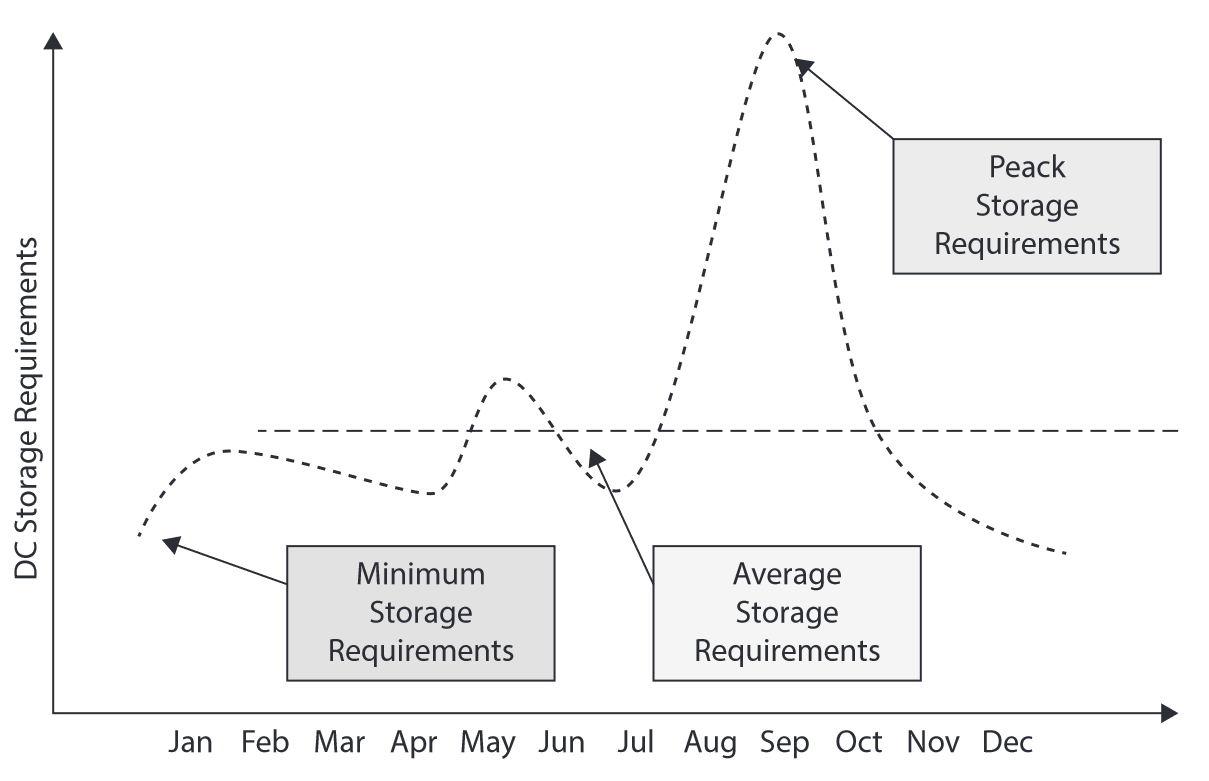
Figure 3: Storage capacity requirements with a short-lived high peak-to-average storage ratio (Frazelle 2016)
Low peak-to-average storage ratio
The storage area should be sized at or very near peak requirements if
- the duration of the peak is for an extended period and
- the peak-to-average storage ratio is low (< 1:2).
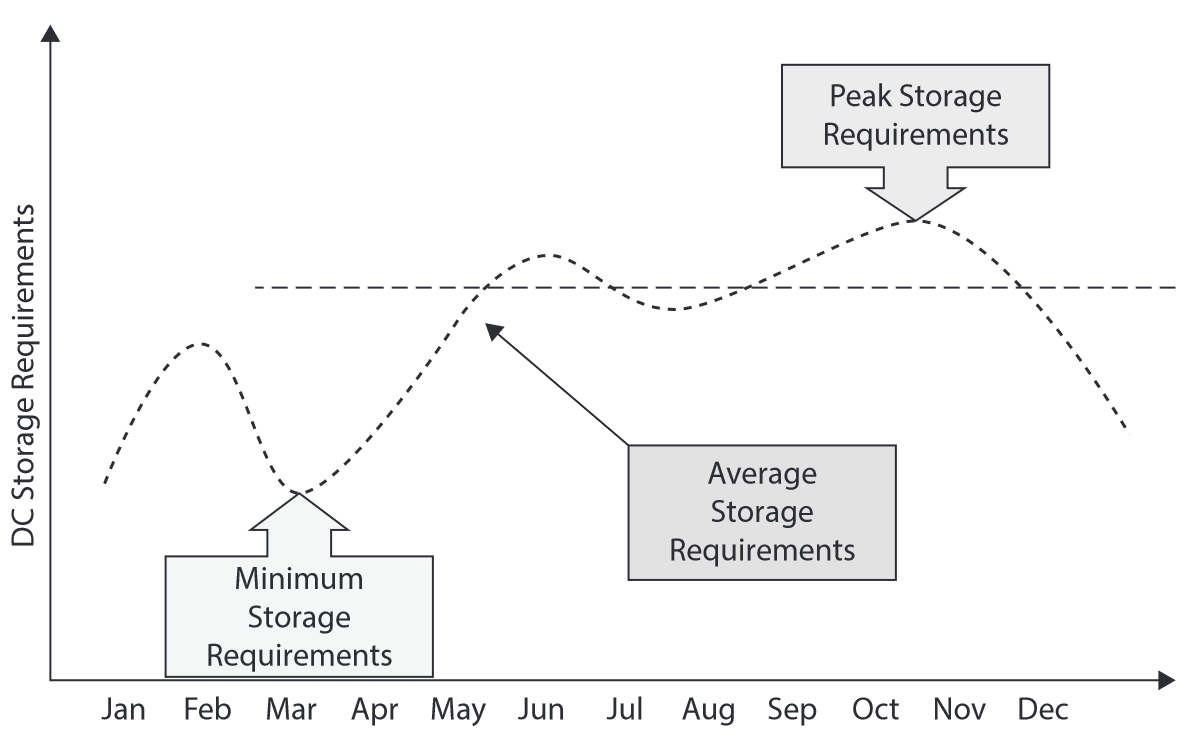
Figure 4: Storage capacity requirements over time with a low peak-to-average storage ratio (Frazelle 2016)
Occupancy vs. productivity
For storage planning purposes, we assume only a portion of the warehouse locations will be occupied.
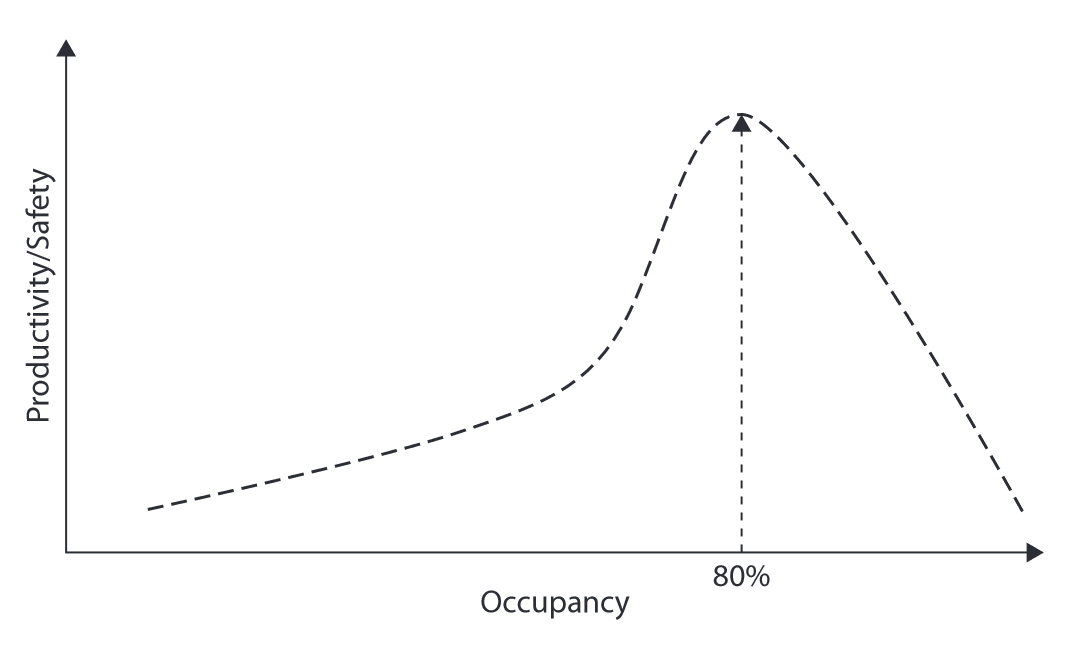
Figure 5: As the utilization of storage locations exceeds 85% in non-real-time warehouses and 90% in real-time warehouses, the productivity and safety of the operations decline dramatically (Frazelle 2016)
Storage total floor space
Calculating the total floor space depends on several factors, such as product, demand, MHE, and building characteristics.

Storage density: equipment and space
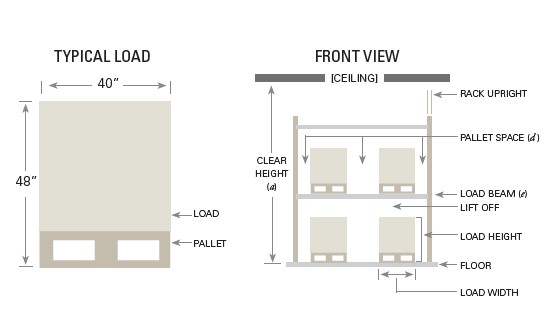
Figure 8: Storage equipment and pallet space requirements.
Storage density: pallet footprint
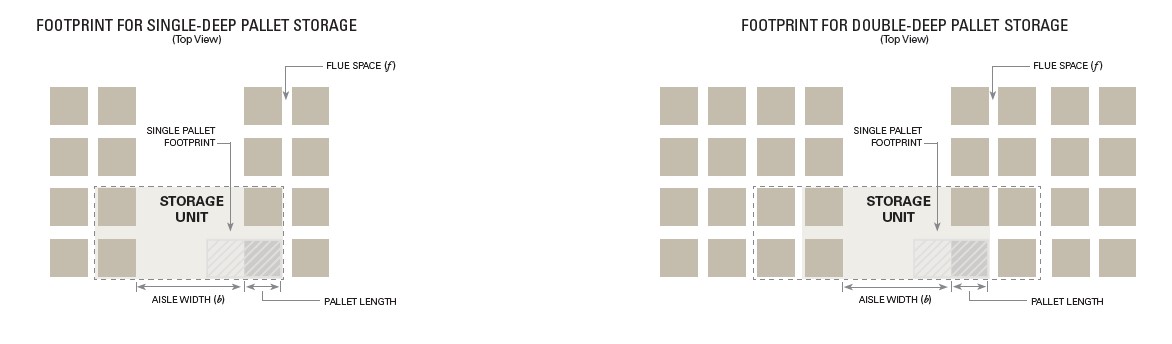
Figure 9: Pallet footprint in single- and double-deep storage.
Floor space calculations use a storage density factor that varies by storage medium and MHE.
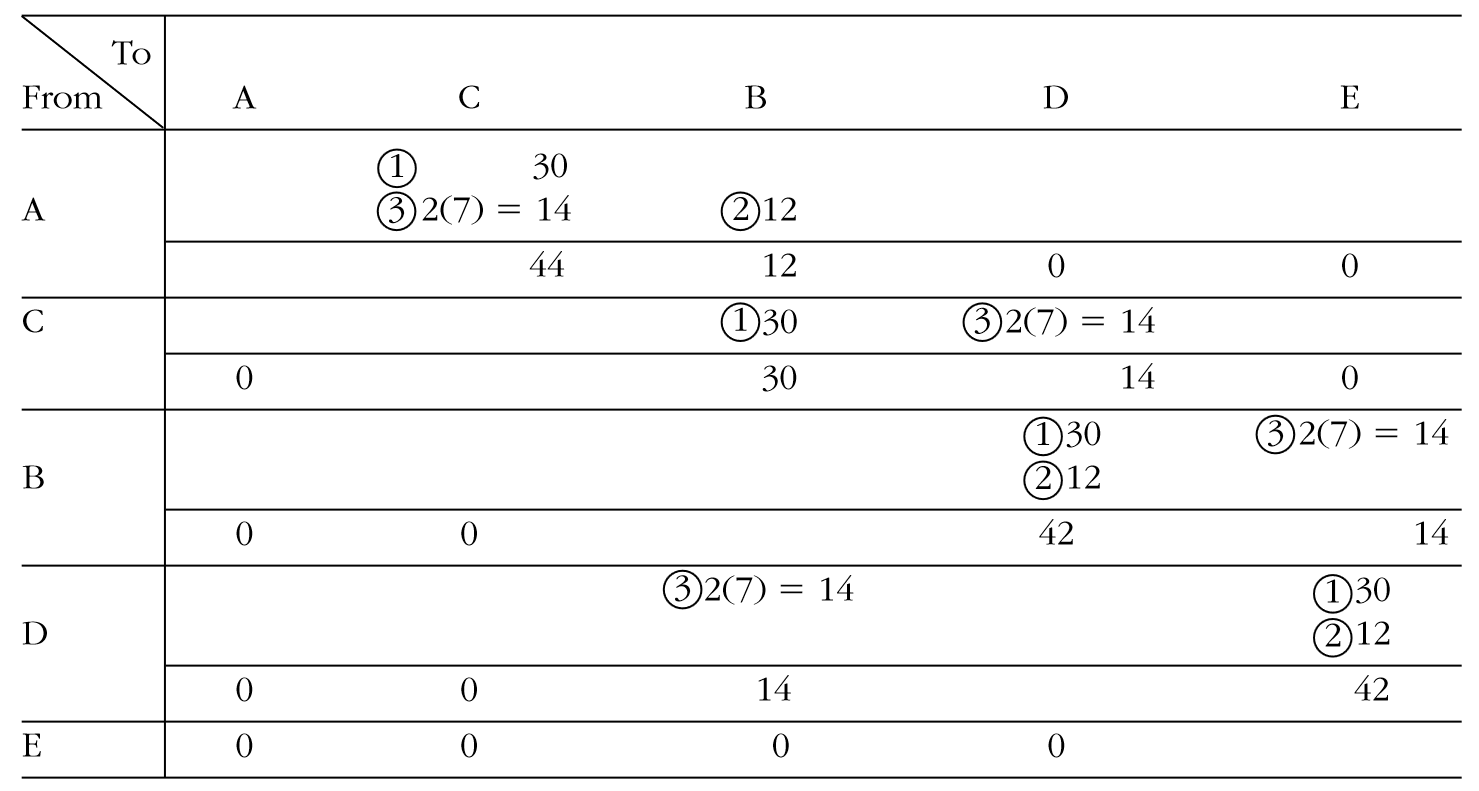
Example: developing the from-to chart
3/3 · Completed chart. Check the flows against the component routes.

Example of relationship chart
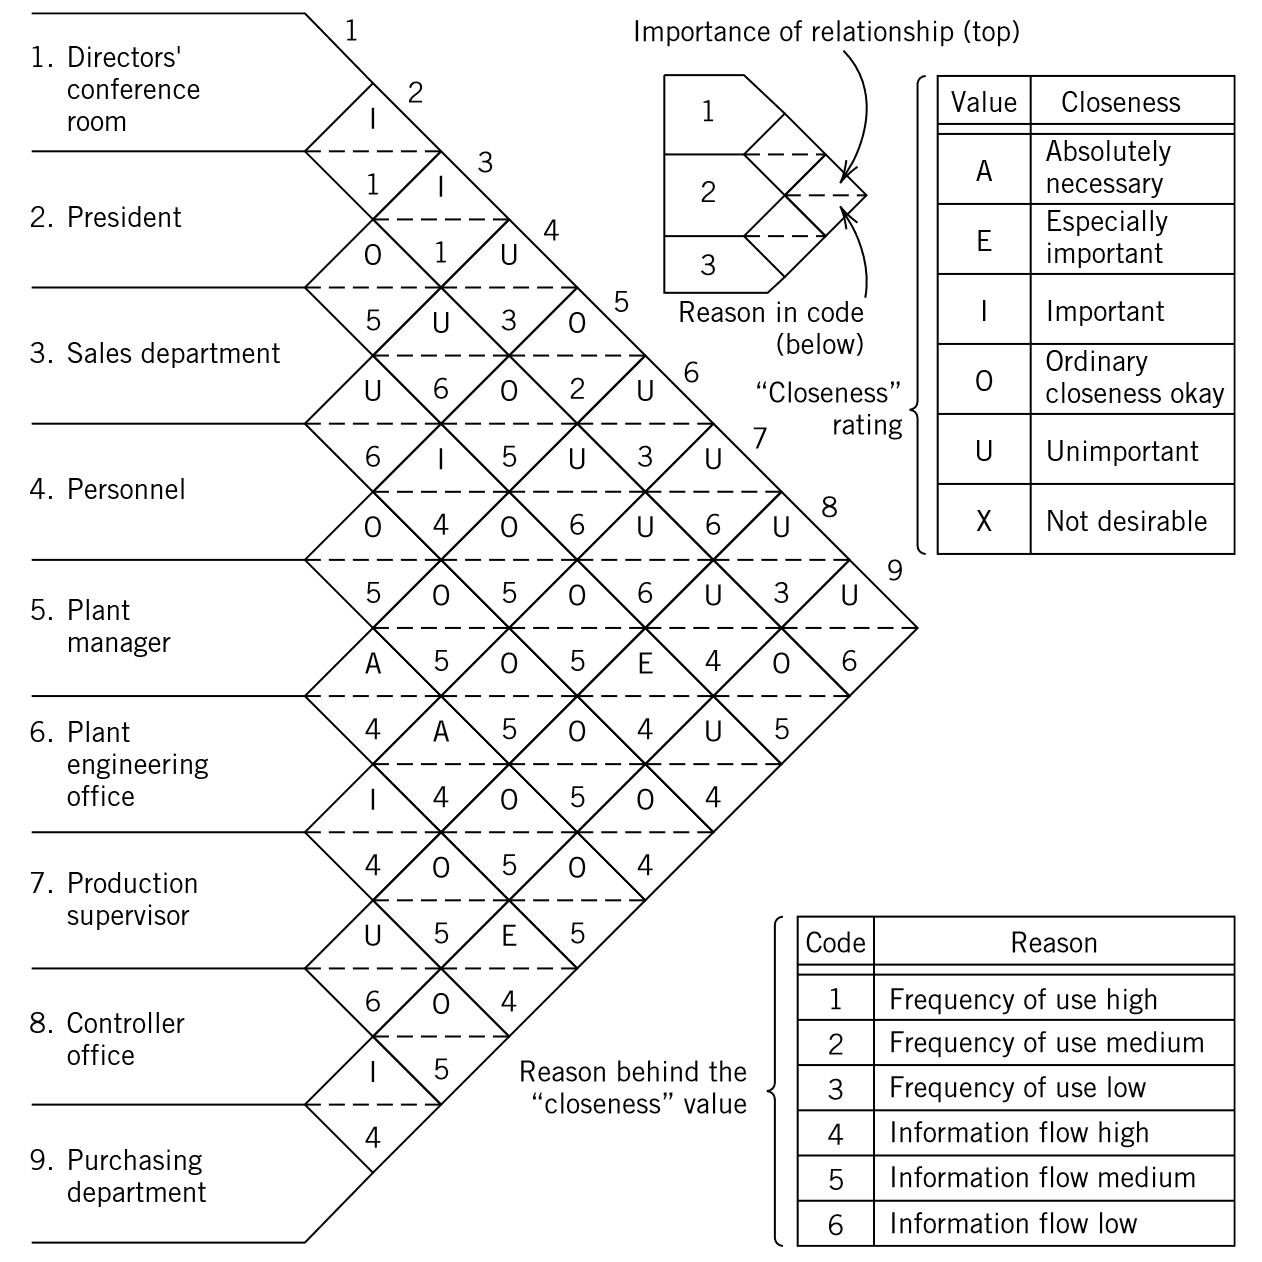
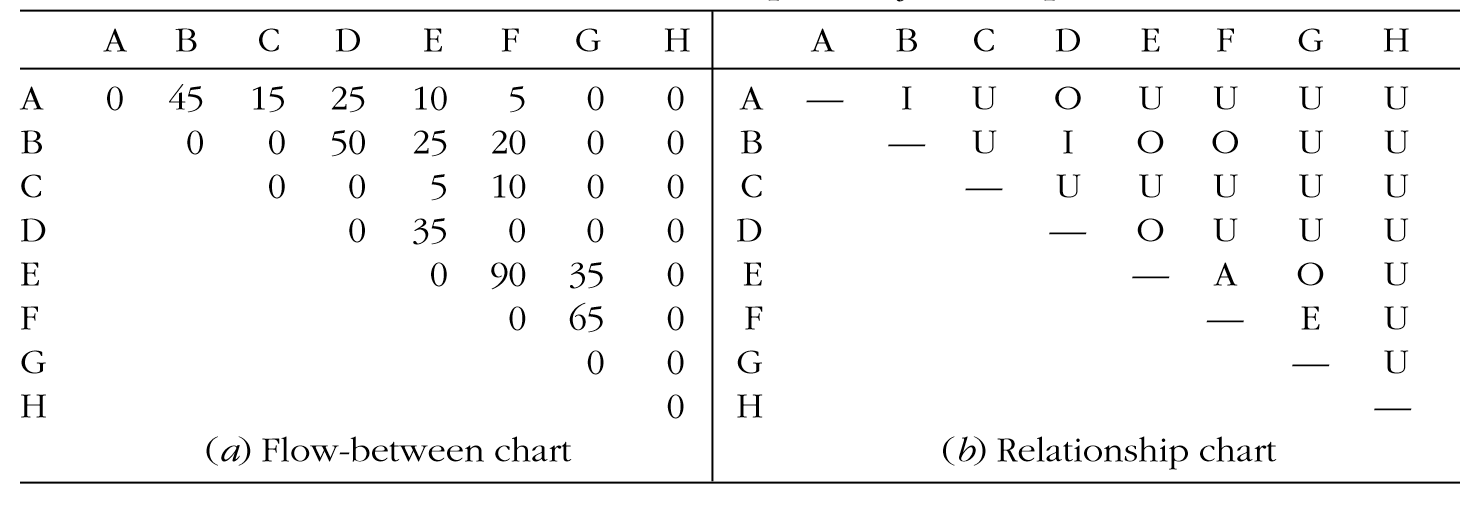
Figure 12: Example of closeness relationship chart (Tompkins 2010).
Warehouse activity relationship
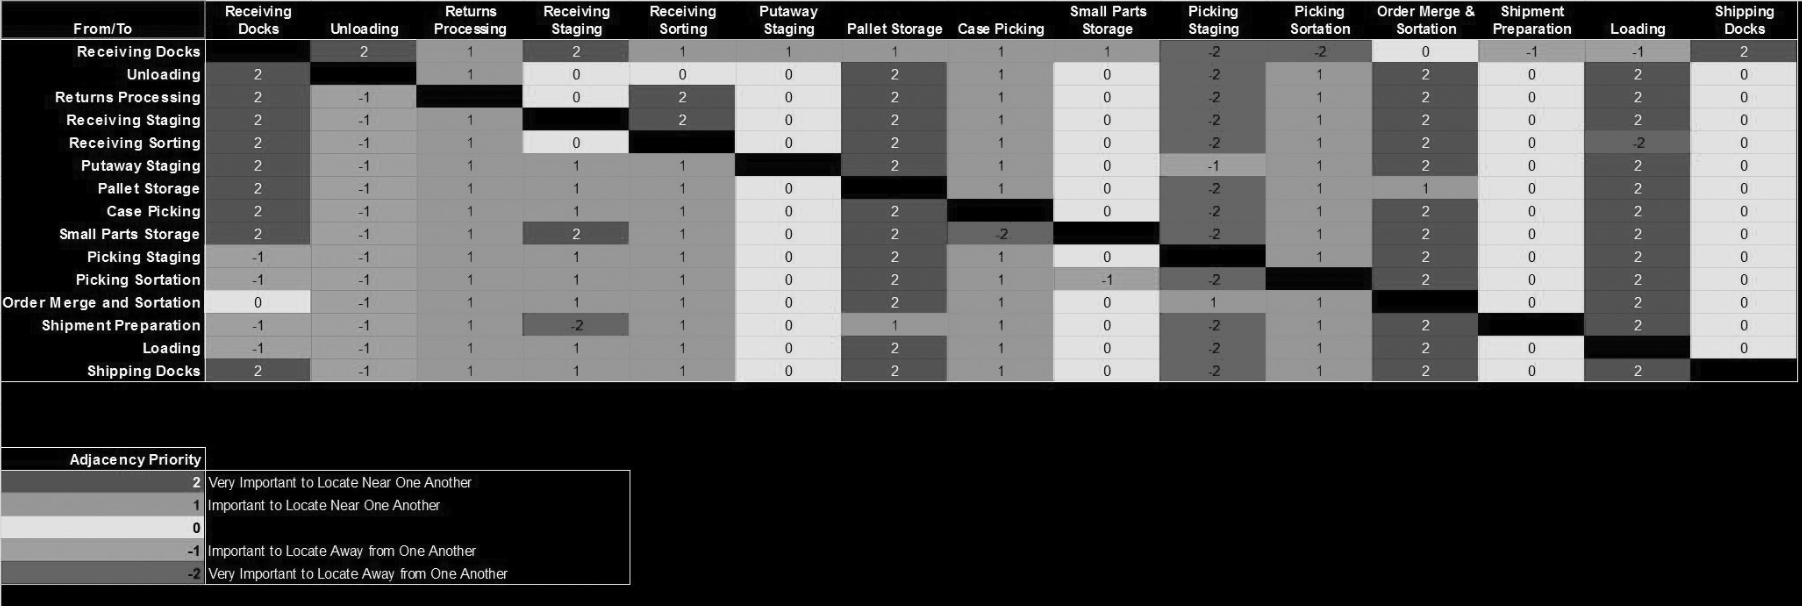
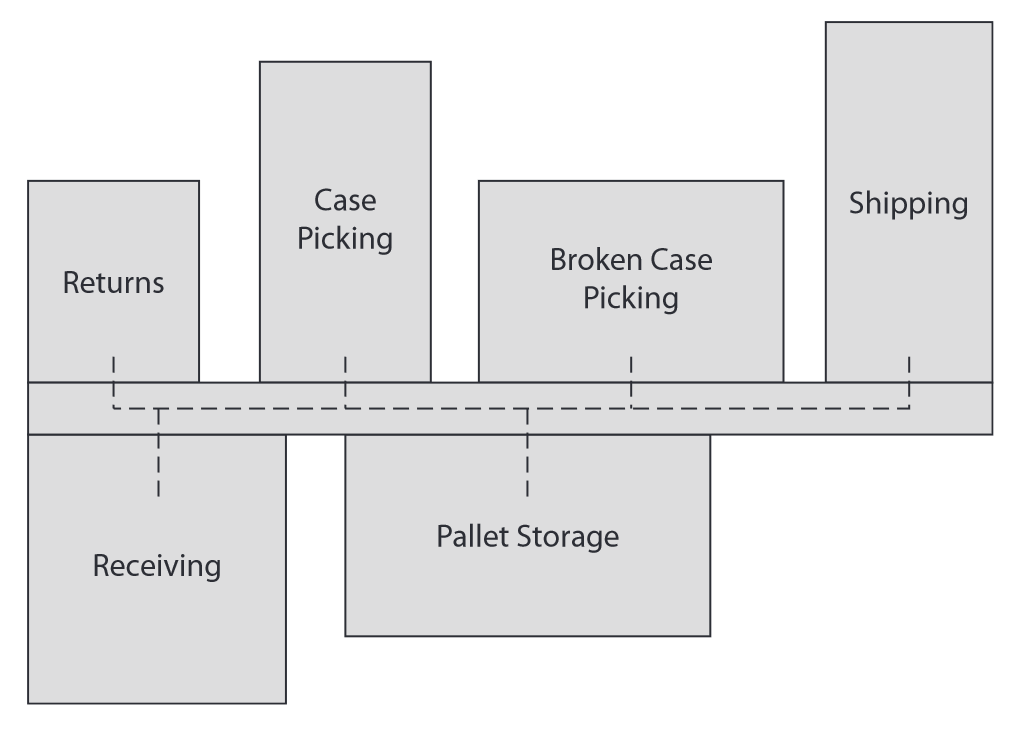
Figure 13: Importance of locating the processes adjacent to one another. For example, it is critical that reserve storage be adjacent to receiving staging for efficient put-away. (Frazelle 2016)
Systematic Layout Planning (SLP)
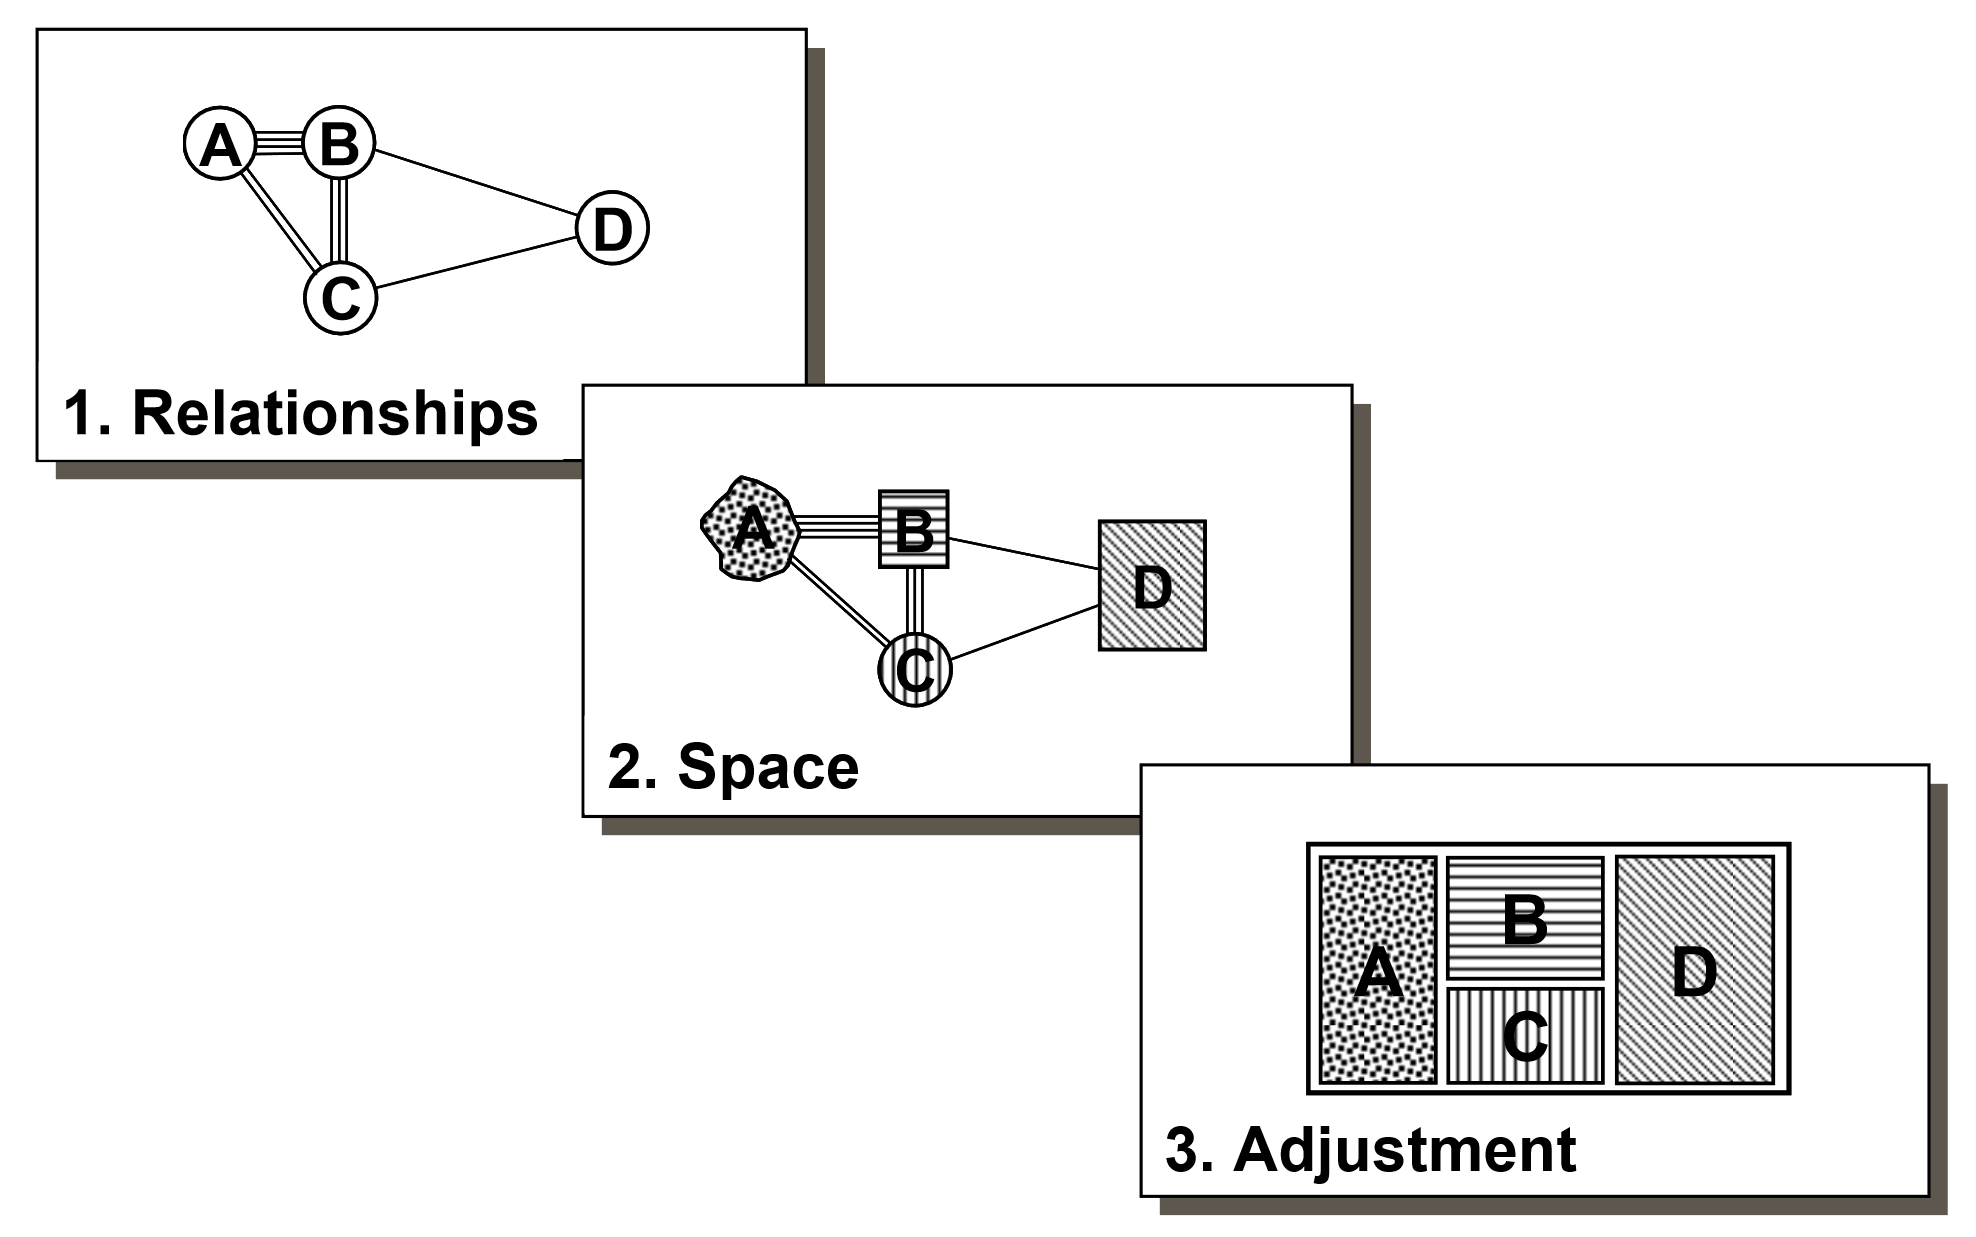
Figure 14: SLP activities: (1) establishing relationships between the layout activities, (2) determining space and dimensions required for each activity, and (3) adjusting relationships and space into an effective plan (see details on Richard Muther 2005; Muther and Hales 2015).
From-to-chart to relationship score
- Convert the from-to chart into a relationship score using closeness ratings:
- Aggregate flows \(f_{ij}\) and \(f_{ji}\) to create a symmetric flow-between chart.
- Divide the maximum flow value into intervals. For example, ratings A, E, I, O, and U lead to five intervals.
- Assign a closeness rating to each pair of departments based on the interval in which the flow value falls.
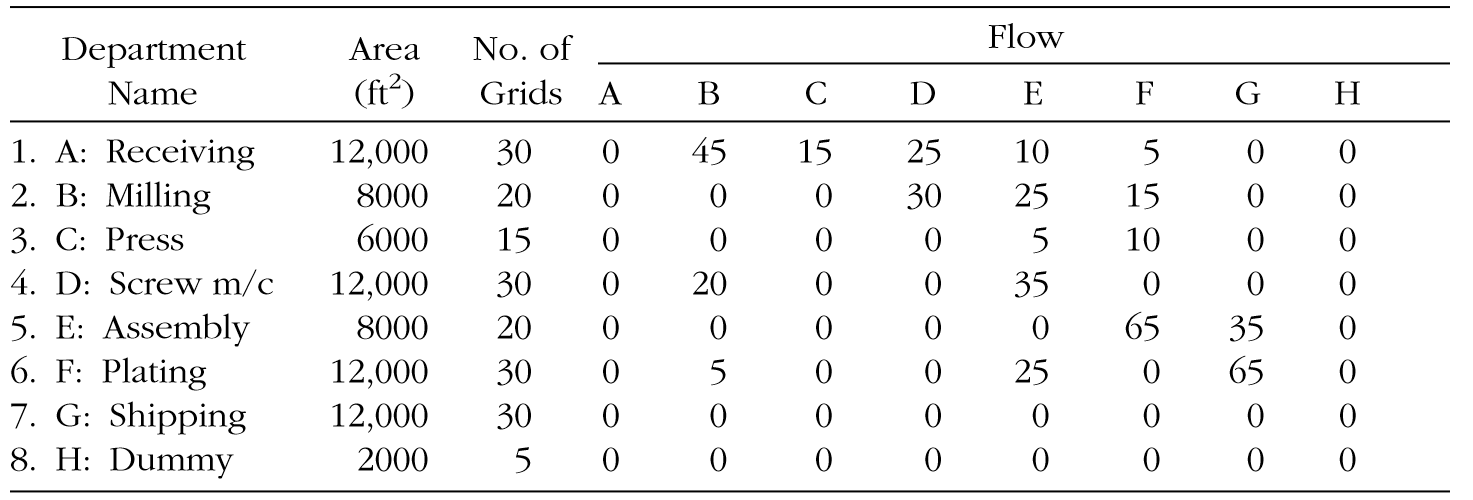
No. of grids = number of equal-area layout cells assigned to a department.
Here, one 20 ft × 20 ft cell = 400 ft² (≈ 37.16 m²). Receiving: 12,000 / 400 = 30 cells.
Material flow planning
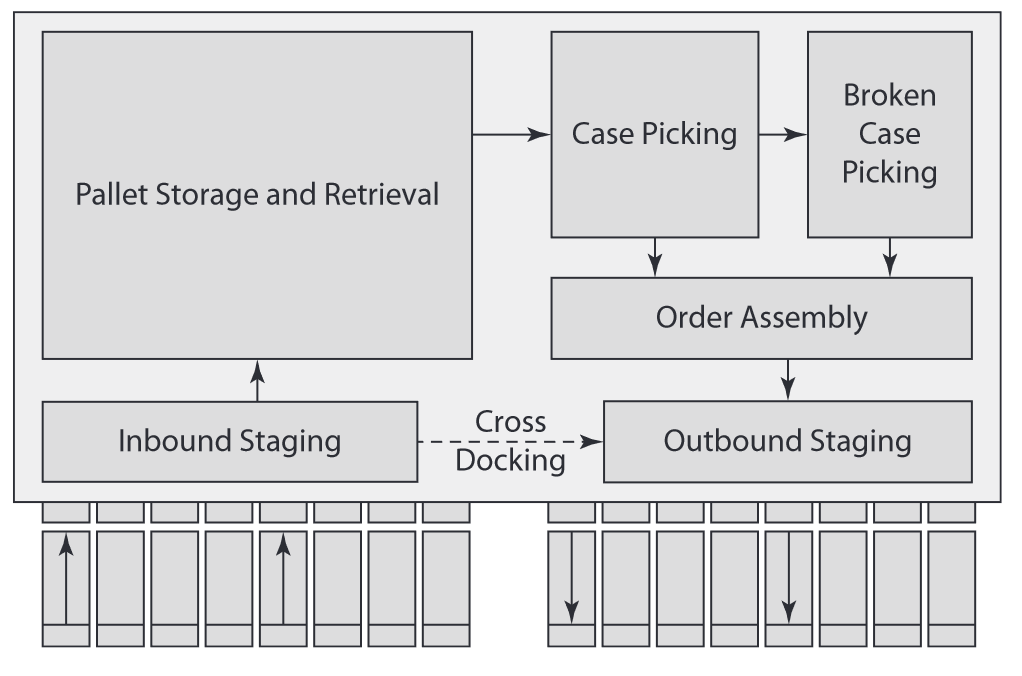
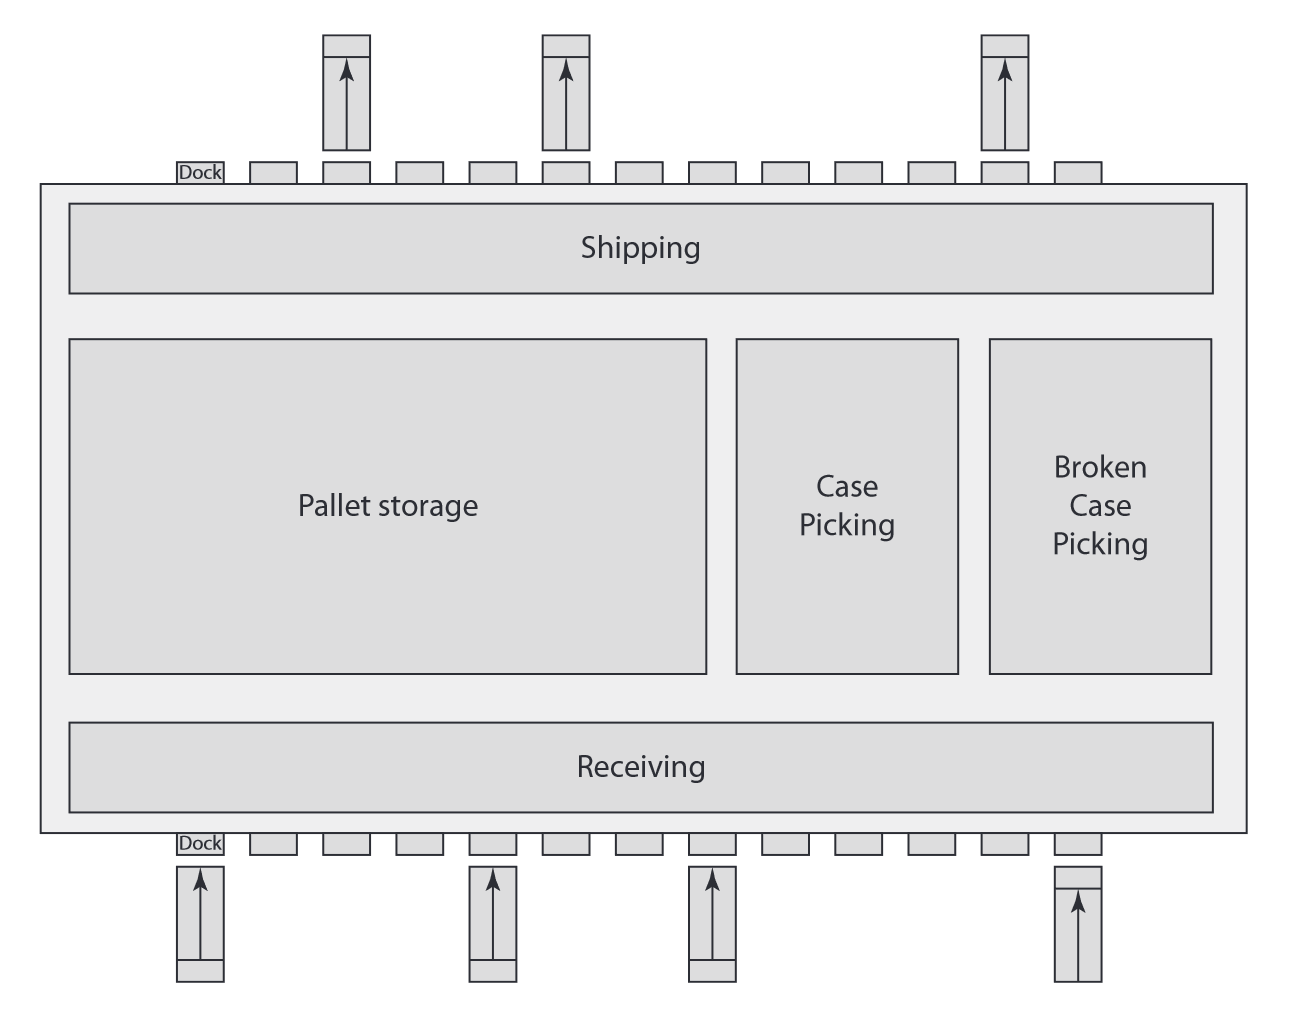
U-shaped, straight-through, modular-spine, and multi-story flow paths work in isolation or in conjunction with one another to form the large majority of warehouse flow paths.


U-Shaped flow
- High utilization of dock resources (receiving and shipping can share dock doors).
- Easier cross-docking (adjacent receiving and shipping docks).
- High lift-truck utilization:
- put-away and retrieval trips are easily combined.
- fast-moving items closest to the receiving and shipping docks.
- Expansion opportunities in three directions.
- Higher security (entry and exit at the single side of the building).
Straight-through I-shaped flow design
Favors operations where the warehouse
- is attached to factories (receipts arriving from production lines).
- is a cross-docking/flow-through facility.
- has coinciding peak receiving and shipping times.
Disadvantages:
- Hard to implement ABC storage and dual-command1 trips.
Modular-spine flow design
Uses a large material-handling spine to connect independent buildings.
Standalone buildings are dedicated to specific warehouse activities in large-scale warehousing and distribution environments. Examples:
- rack-supported buildings for a unit-load automated storage and retrieval system (ASRS);
- air-conditioned building for customizing operations such as monogramming, pricing, and marking;
- building dedicated to returns processing;
- shipping building equipped with high-speed sorting equipment.