Warehouse design: Facility planning

Design often requires a mixture of analytical skills and creativity. Rouwenhorst et al. (2000)

🧠 Learning objectives

  • Explain role of flow in facility planning.
  • Draw from-to and activity relationship charts using basic flow and routing data.
  • Derive qualitative relationship charts from quantitative from-to charts.
  • Apply the systematic layout planning (SLP) methodology to determine a block layout.

Facility requirements

Facility requirement considerations (Tompkins 2010):

  • Space requirements
    • storage systems
    • material handling equipment
    • office, cafeteria, restroom, etc.
  • Flow systems
    • Movement of goods, materials, energy, information, and/or people.
  • Activity relationships
    • Useful to measure flow

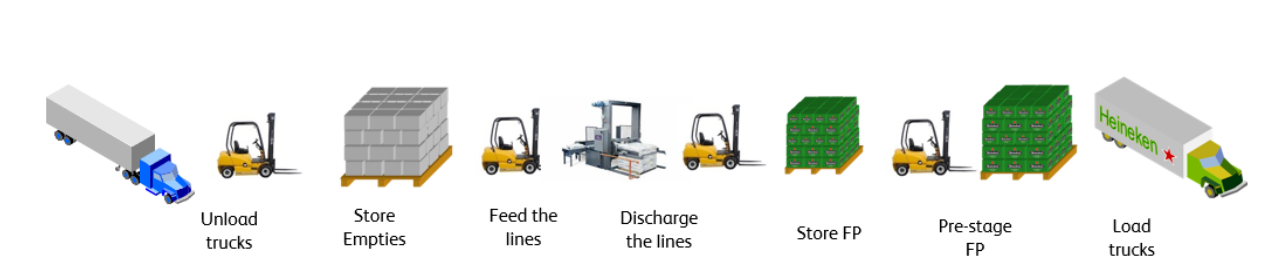
Figure 1: Example of internal flow in Heineken’s brewery. The process begins with “unload trucks,” where trucks with empties are discharged using forklifts. Next, “store empties” involves moving empties to the empty yard for storage. “Feed the lines” transfers empty bottles to production lines for filling. The “discharge the lines” step moves finished products (FP) to storage locations, followed by “pre-stage FP” to prepare orders for efficient truck loading. Finally, “load trucks” completes the process by loading FP into trucks for client delivery. Each step involves transportation and handling activities (Aussaresse 2023).

Design steps

The design process encompasses the following steps, regardless of decision level (Rouwenhorst et al. 2000):

  1. Data acquisition.
  2. Functional and technical specifications.
  3. Selection of means and equipment.
  4. Layout planning.
  5. Selection of planning and control policies.

Remember: facilities planning is an iterative process.

Warehouse design sequences

Design sequences vary, but follow similar steps.

Baker and Canessa (2009)

  1. Define system requirements.
  2. Define and obtain data.
  3. Analyze data.
  4. Establish the unit loads to use.
  5. Determine operating procedures and methods.
  6. Consider possible equipment types and characteristics.
  7. Calculate equipment capacities and quantities.
  8. Define services and ancillary operations.
  9. Prepare possible layouts.
  10. Evaluate and assess the alternatives.
  11. Identify the preferred design.

Frazelle (2016)

  1. Determine space requirements for all warehouse functions.
  2. Locate functions with high adjacency requirements close to one another.
  3. Assign high-storage activities to high-bay space and labor-intensive processes to low-bay space.
  4. Determine flow paths.
  5. Assign the optimal material-handling method to each flow path.
  6. Minimize space requirements.
  7. Develop and document expansion and contraction strategies.

Warehouse floor-space requirement planning

The main floor-space areas within the warehouse that need to be calculated are (Richards 2014):

  • Receiving area
  • Quarantine and inspection area
  • Reserve storage area
  • Carton-picking area
  • Item-pick area
  • Value-adding services area
  • Packing area
  • Dispatch area
  • Cross-dock area
  • Empty pallet and packaging storage area
  • MHE charging areas
  • Warehouse offices
  • Restrooms

The information collected to calculate space is normally current or historical. Future volumes and changes also need to be considered!

Storage capacity requirements

Should we design storage to accommodate peaks in business, average activity, or somewhere in between?

Short-lived high peak-to-average storage ratio

Outside warehousing and/or trailer storage should be considered to accommodate the peak storage requirement if:

  • the duration of the peak is short-lived (<0.5 year), and
  • the peak-to-average storage ratio is high (> 1:5), then
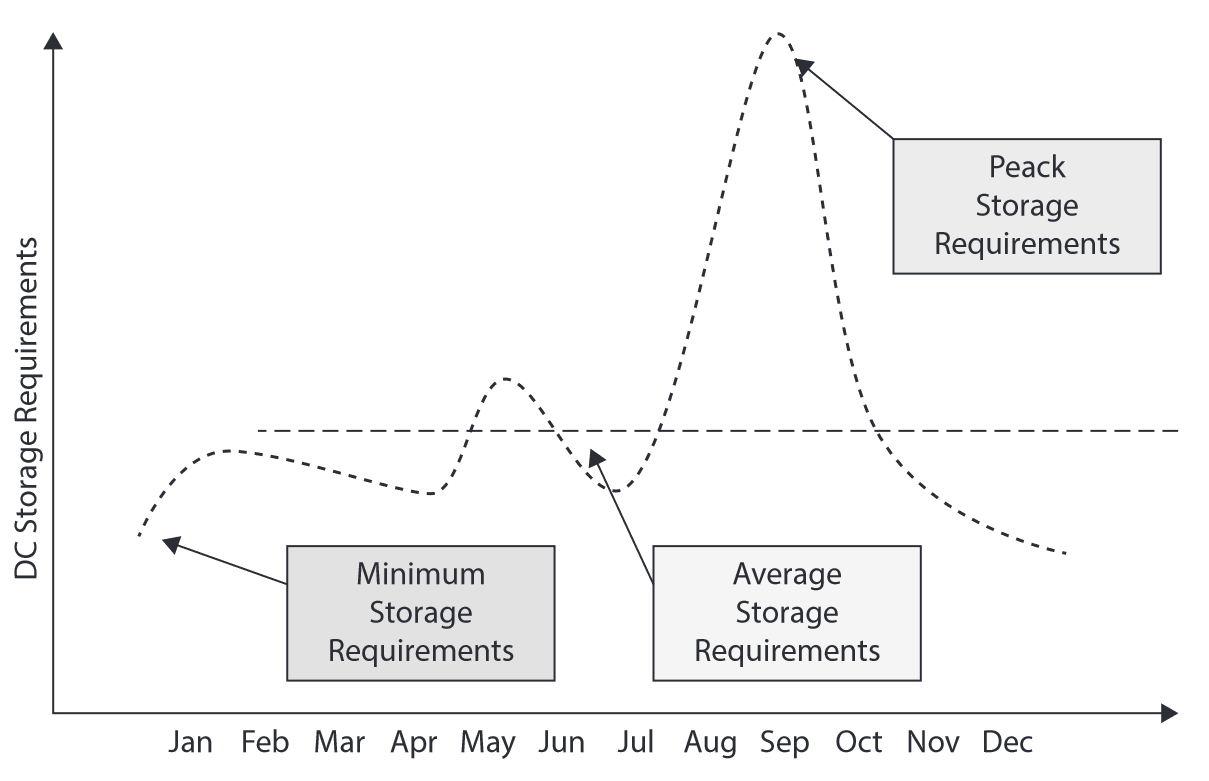
Figure 3: Storage capacity requirements with a short-lived high peak-to-average storage ratio (Frazelle 2016)

Low peak-to-average storage ratio

The storage area should be sized at or very near peak requirements if

  • the duration of the peak is for an extended period and
  • the peak-to-average storage ratio is low (< 1:2).
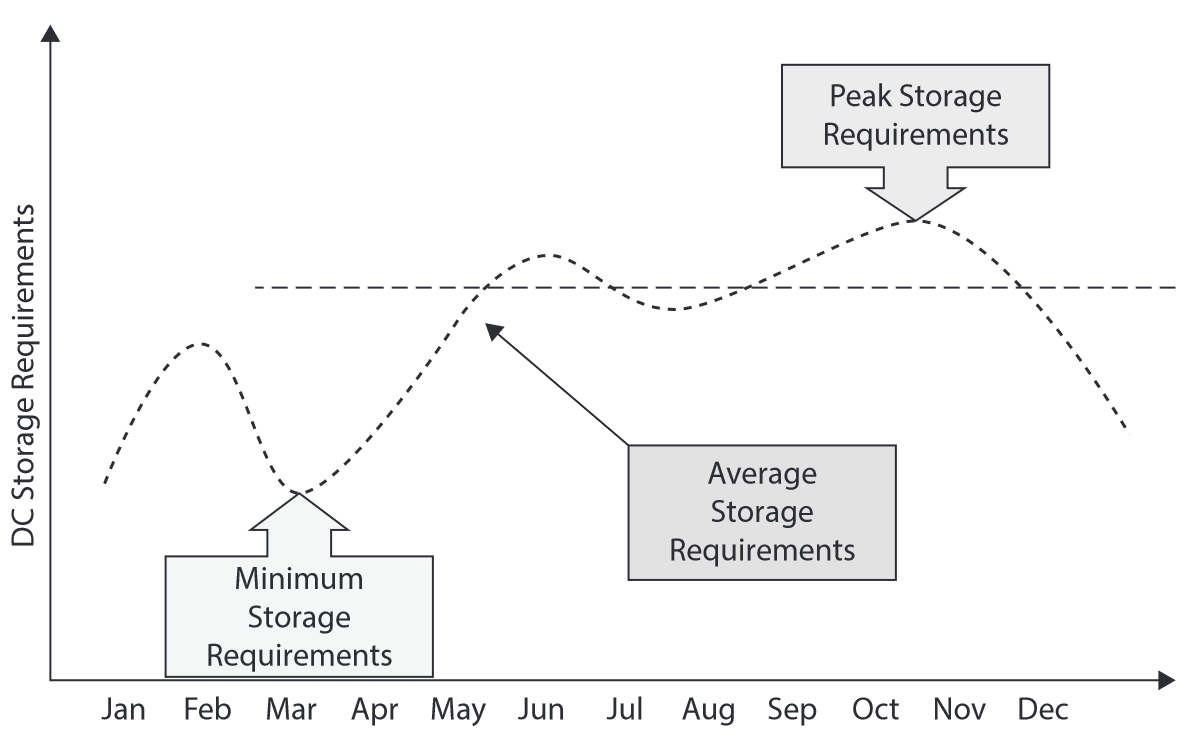
Figure 4: Storage capacity requirements over time with a low peak-to-average storage ratio (Frazelle 2016)

Occupancy vs. productivity

For storage planning purposes, we assume only a portion of the warehouse locations will be occupied.
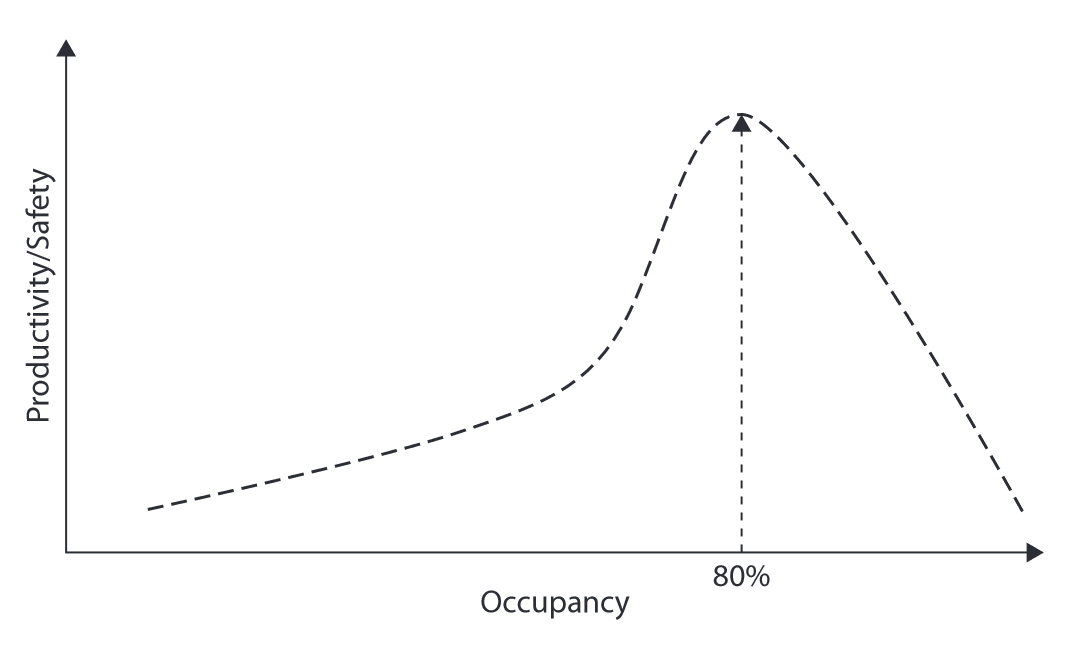
Figure 5: As the utilization of storage locations exceeds 85% in non-real-time warehouses and 90% in real-time warehouses, the productivity and safety of the operations decline dramatically (Frazelle 2016)

Storage total floor space

Calculating the total floor space depends on several factors, such as product, demand, MHE, and building characteristics.

Figure 6: Number of pallet locations required and the height requirement for each location (based on Richards 2014)
Figure 7: SKU characteristics and possible storage media (based on Richards 2014)
Storage density: equipment and space

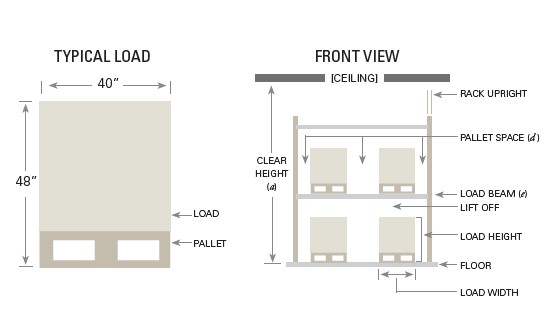
Figure 8: Storage equipment and pallet space requirements.

Storage density: pallet footprint
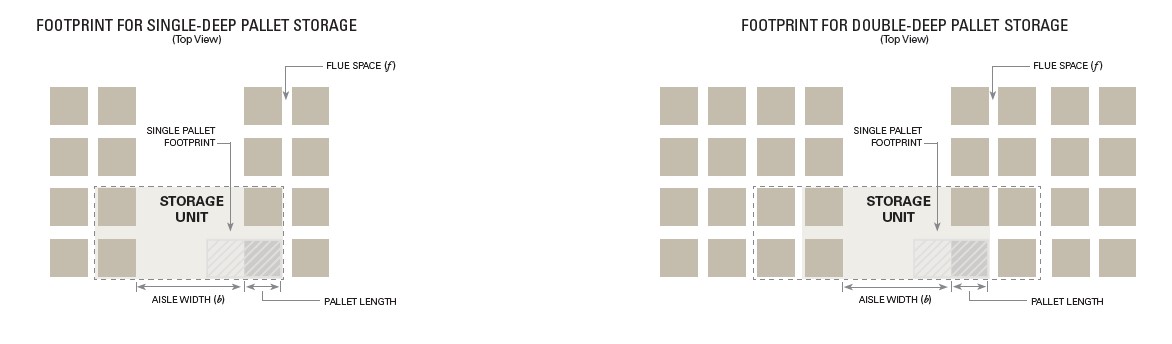
Figure 9: Pallet footprint in single- and double-deep storage.

Floor space calculations use a storage density factor that varies by storage medium and MHE.

Calculation steps
  1. Calculate the average unit inventory as a function of the annual demand and inventory turn rate1:

\[ \text{Avg. unit inventory} = \frac{\text{Forecasted unit sales}}{\text{Annual inventory turns}} \]

  1. Then, calculate the average pallet inventory:

\[ \text{Avg. pallet inventory} = \frac{\text{Avg. unit inventory}}{\text{Avg. units/pallet}} \]

  1. Next, calculate the peak (pallet) inventory:

\[ \text{Peak inventory} = \text{Avg. inventory}\times\text{Peak-to-average ratio} \]

  1. Only a portion of peak inventory is considered to compute the storage capacity:

\[ \begin{aligned} \text{Effective storage capacity} &= \text{Pct. peak planning} \\ &\quad \times \text{Peak inventory} \end{aligned} \]

  1. The required number of pallet positions is divided by a location utilization factor2:

\[ \text{Inventory positions} = \frac{\text{Effective storage capacity}}{\text{Location utilization factor}} \]

  1. Floor space requirements are calculated using a predetermined storage density:

\[ \text{Floor space} = \text{Inventory positions}\times\text{Storage density} \]

Finding additional space

When facing a shortage of space, warehouse managers could consider:

  • Expanding the warehouse
  • Renting additional space
  • Creating more space within the existing premises
    • Reducing inventory levels (e.g., excluding slow movers)
    • Changing storage and MHE
    • Consolidating stock (trade-off with labor)
    • Reducing beam heights (accommodate half-, quarter-pallets)
    • Moving from fixed locations to random locations.
    • Using temporary storage structures (e.g., sea containers and trailers)

Activity relationships

Helps evaluate alternative department-layout arrangements.

Quantitative measures

  • Used in facilities having large volumes of materials, information, and people moving between departments.
  • Examples:
    • pieces per hour
    • moves per day
    • kg per week

Qualitative measures

  • Used in facilities having significant communication and organizational interrelations.
  • Ranges from
    1. absolute necessity that two departments be close to each other
    2. preference that two departments not be close to each other

Frequently, a facility will have a need for both quantitative and qualitative measures of flow.

Quantitative flow measurement

  • Measurements recorded in a from-to-chart in terms of the amount moved between departments.

  • To create a from-to-chart:

    1. List all departments down the row and across the column following the overall flow pattern.
    2. Establish a measure of flow for the facility that accurately indicates equivalent flow volumes.
    3. If the items moved are equivalent regarding ease of movement, the number of trips may be recorded in the from-to chart.
    4. If the items moved vary in size, weight, value, risk of damage, shape, and so on, then some common unit of measure may be established so that the quantities recorded in the from-to chart represent the proper relationships among the volumes of movement.
    5. Based on the flow paths for the items to be moved and the established measure of flow, record the flow volumes in the from-to chart.

Example: developing the from-to chart

1/3 · Equivalent flow and routing. Use a common movement unit before adding flows (Tompkins 2010).

Assumed linear layout (overall flow →): A → C → B → D → E.

Component Units/day Movement factor Equivalent flow/day Routing
1 30 1 30 × 1 = 30 A → C → B → D → E
2 12 1 12 × 1 = 12 A → B → D → E
3 7 2 7 × 2 = 14 A → C → D → B → E

Each consecutive pair is a directed move.

Component 3 contributes 14, rather than 7, to A → C, C → D, D → B, and B → E.

Example: developing the from-to chart

2/3 · Build the chart. Assumed linear layout: A → C → B → D → E (overall flow →).

Component 1 · 30/day

A → C → B → D → E

Add 30 to A–C, C–B, B–D, and D–E.

Component 2 · 12/day

A → B → D → E

Add 12 to A–B, B–D, and D–E.

Component 3 · 14/day

A → C → D → B → E

Add 14 to A–C, C–D, D–B, and B–E.

From ↓ / To → · Equivalent flow/day

A C B D E
A —
30+ 14
44
12
12
0
0
C
0
—
30
30
14
14
0
B
0
0
—
30+ 12
42
14
14
D
0
0
14
14
—
30+ 12
42
E
0
0
0
0
—

A → C = 30 + 14 = 44. Sum contributions within each cell.

D → B = 14: returns to an earlier department in this layout (backtracking).

Linear layout, component data, and routing: Tompkins (2010).

Example: developing the from-to chart

3/3 · Completed chart. Check the flows against the component routes.

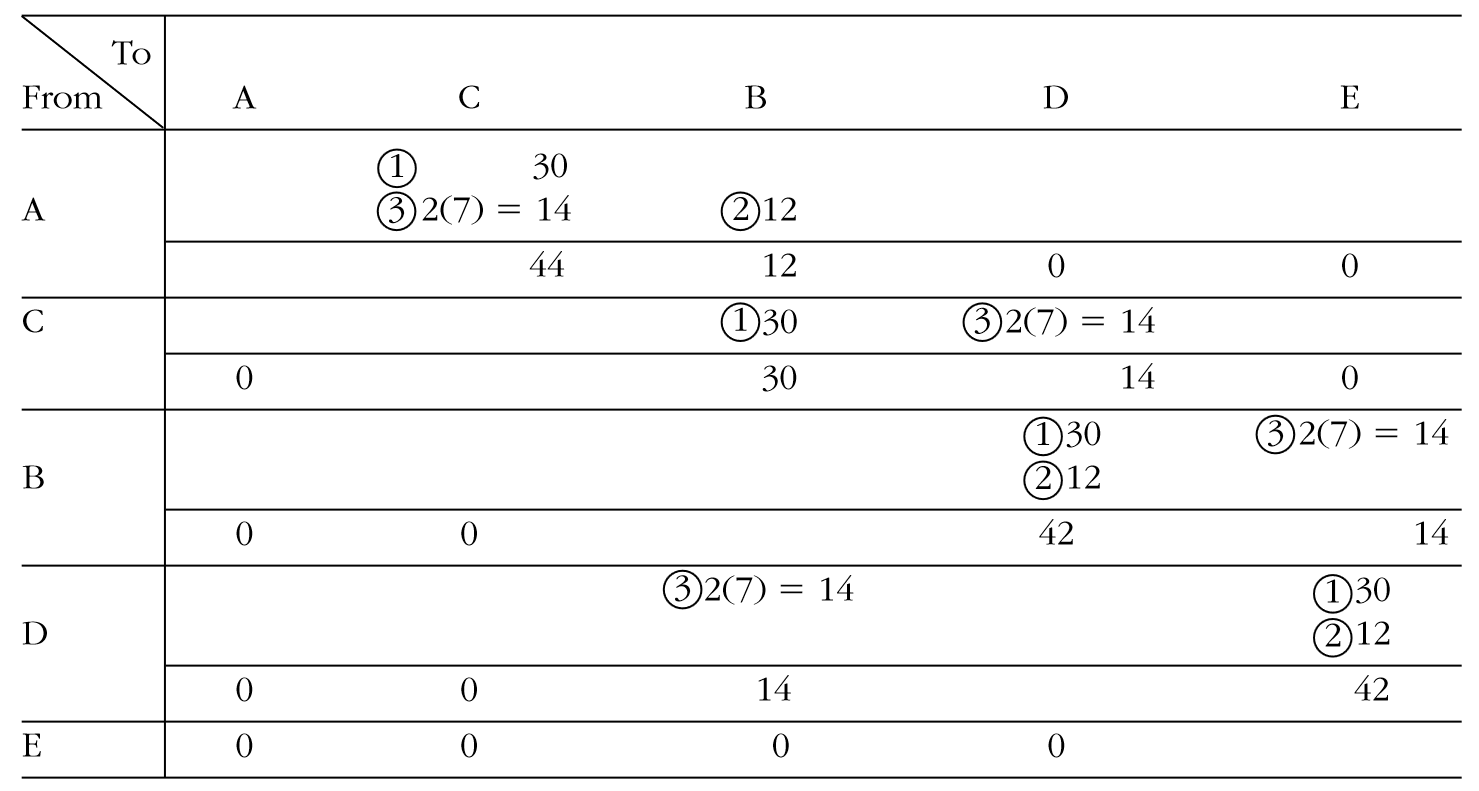
Figure 10: 3 components being transported through departments A–E arranged in order A-C-B-D-E. Components 1 and 2 have the same size and weight, and component 3 is almost twice as large (thus movement factor is 2) (Tompkins 2010)
Figure 11: From-to chart indicates the volume of equivalent flows for each (circled) component (Tompkins 2010)

Qualitative flow measurement

  • Measures flow using the closeness relationship ratings developed by Muther and Hales (2015).

  • A relationship chart may be constructed as follows:

    1. List all departments on the relationship chart.
    2. Conduct interviews or surveys with persons from each department listed on the relationship chart and with the management responsible for all departments.
    3. Define the criteria for assigning closeness relationships and itemize and record the criteria as the reasons for relationship values on the relationship chart.
    4. Establish the relationship value and the reason for the value for all pairs of departments.
    5. Allow everyone having input to the development of the relationship chart an opportunity to evaluate and discuss changes in the chart.

Example of relationship chart

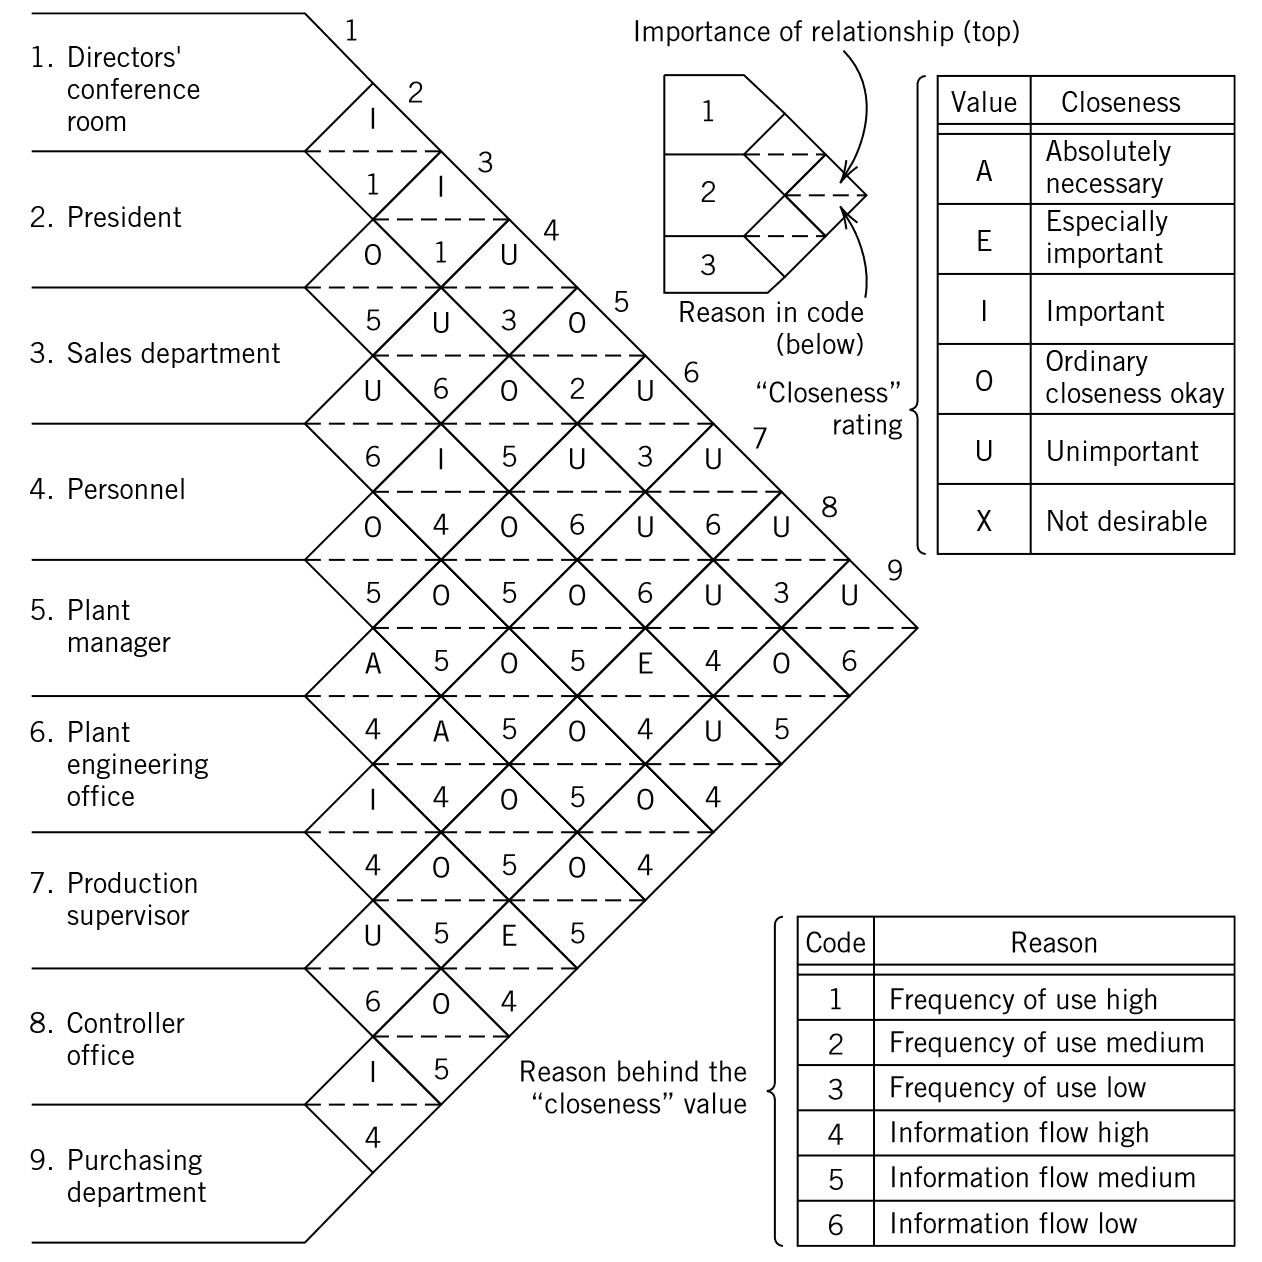
Figure 12: Example of closeness relationship chart (Tompkins 2010).

Warehouse activity relationship
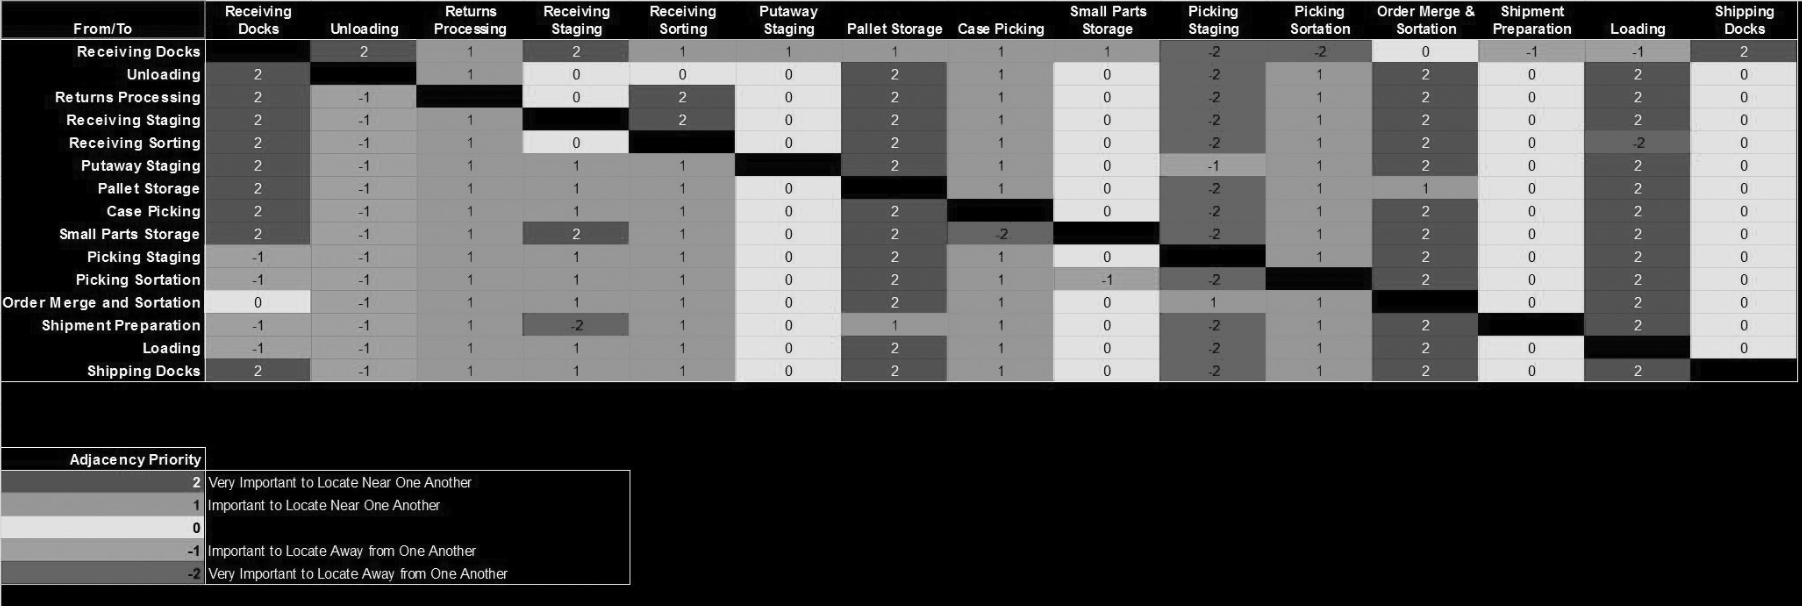
Figure 13: Importance of locating the processes adjacent to one another. For example, it is critical that reserve storage be adjacent to receiving staging for efficient put-away. (Frazelle 2016)

Systematic Layout Planning (SLP)
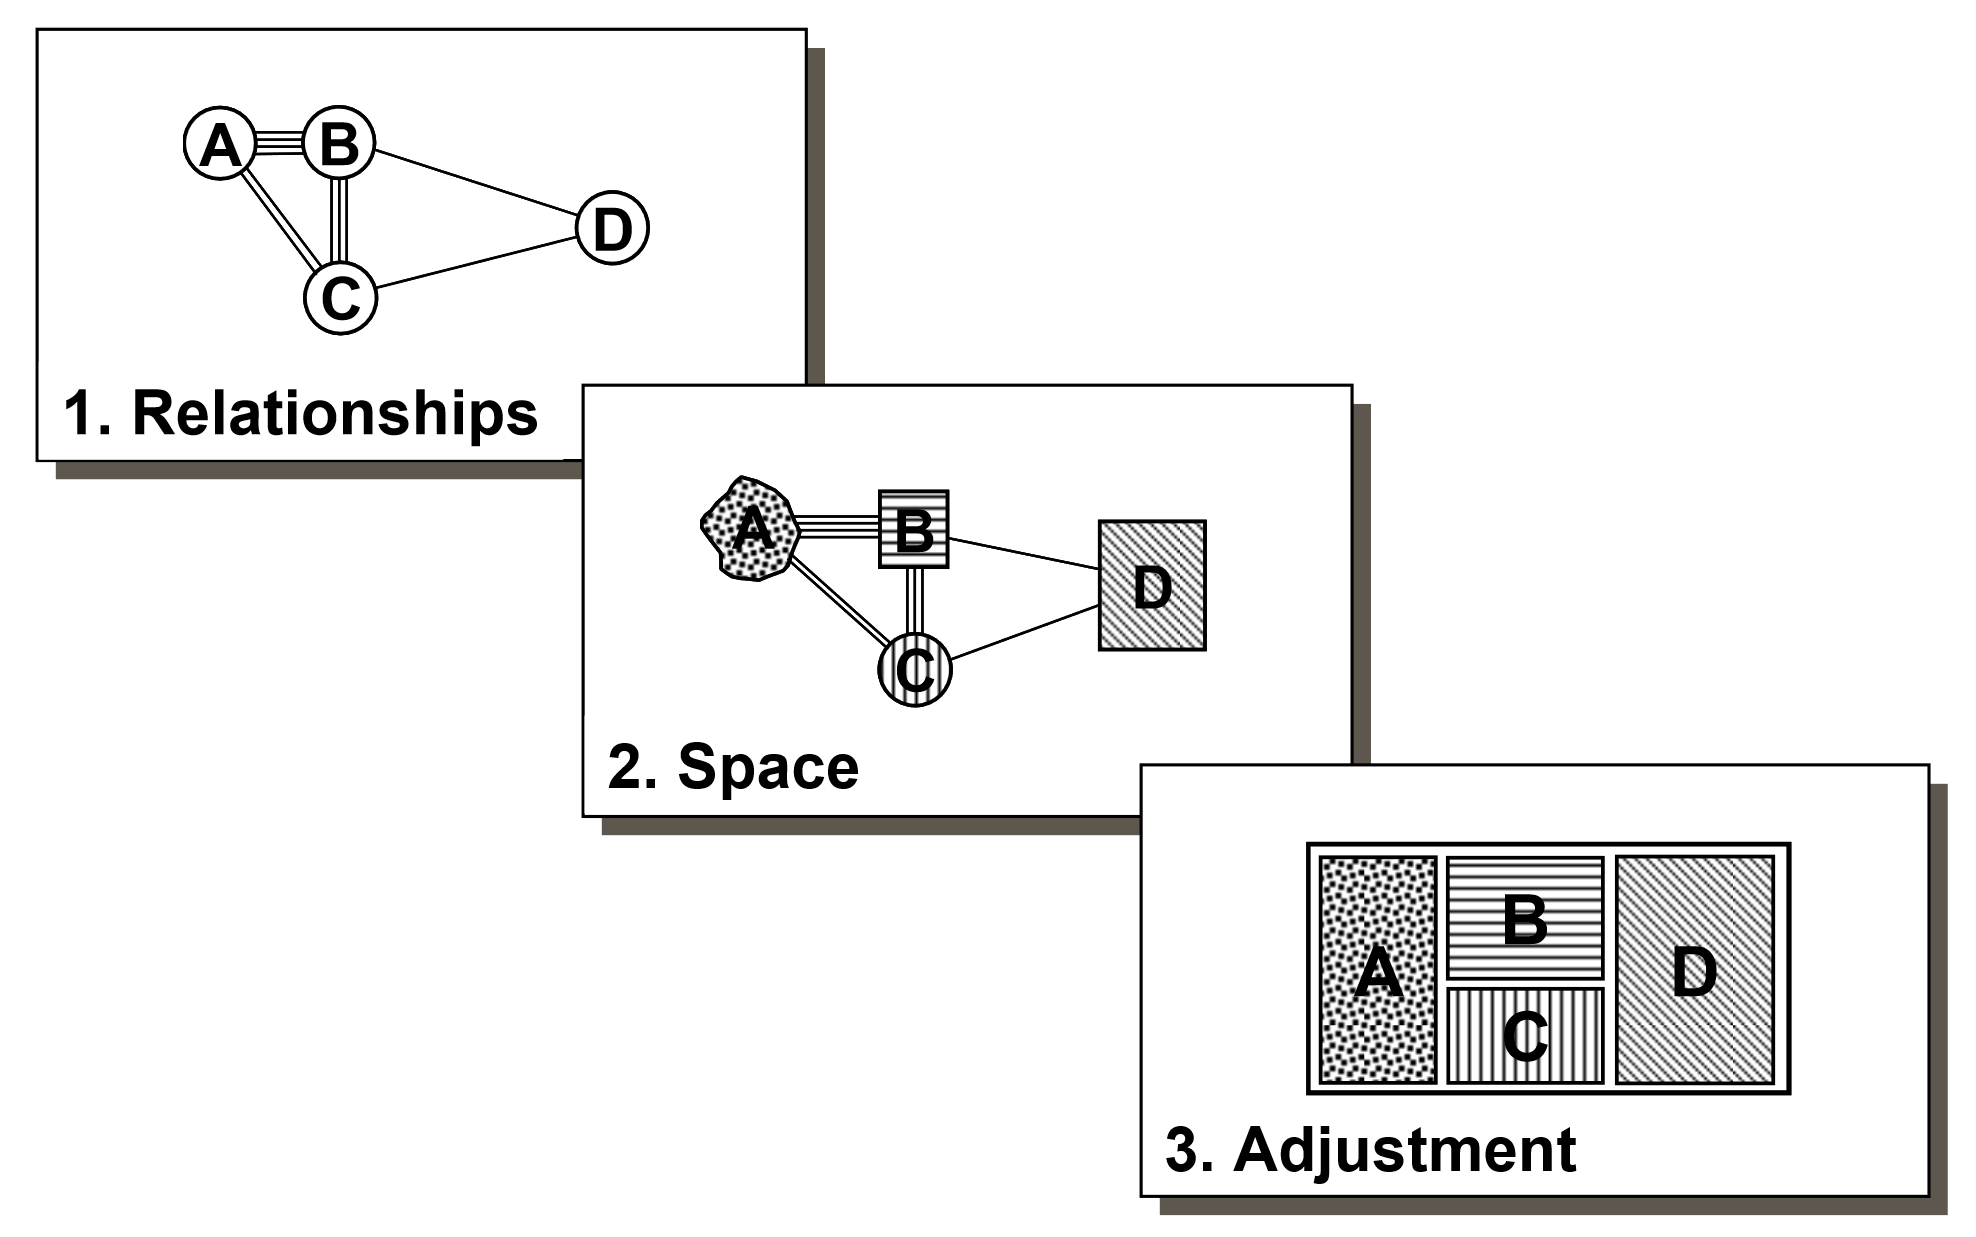
Figure 14: SLP activities: (1) establishing relationships between the layout activities, (2) determining space and dimensions required for each activity, and (3) adjusting relationships and space into an effective plan (see details on Richard Muther 2005; Muther and Hales 2015).

From-to-chart to relationship score

  • Convert the from-to chart into a relationship score using closeness ratings:
    1. Aggregate flows \(f_{ij}\) and \(f_{ji}\) to create a symmetric flow-between chart.
    2. Divide the maximum flow value into intervals. For example, ratings A, E, I, O, and U lead to five intervals.
    3. Assign a closeness rating to each pair of departments based on the interval in which the flow value falls.
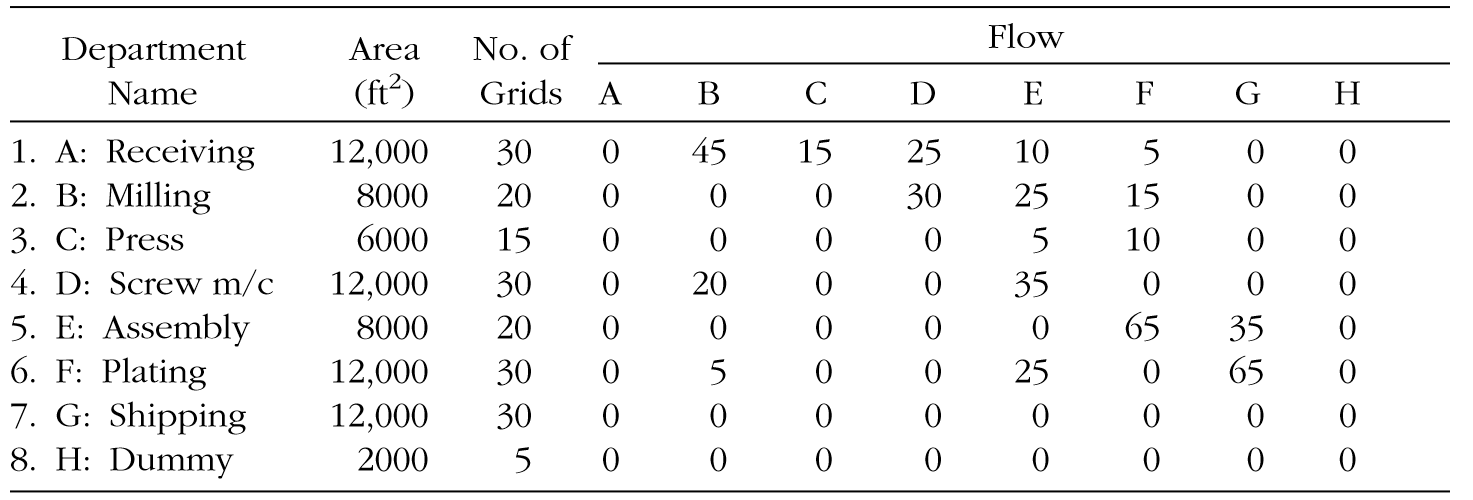
Figure 15: Departmental data and from-to chart. (Tompkins 2010)

No. of grids = number of equal-area layout cells assigned to a department.

Here, one 20 ft × 20 ft cell = 400 ft² (≈ 37.16 m²). Receiving: 12,000 / 400 = 30 cells.
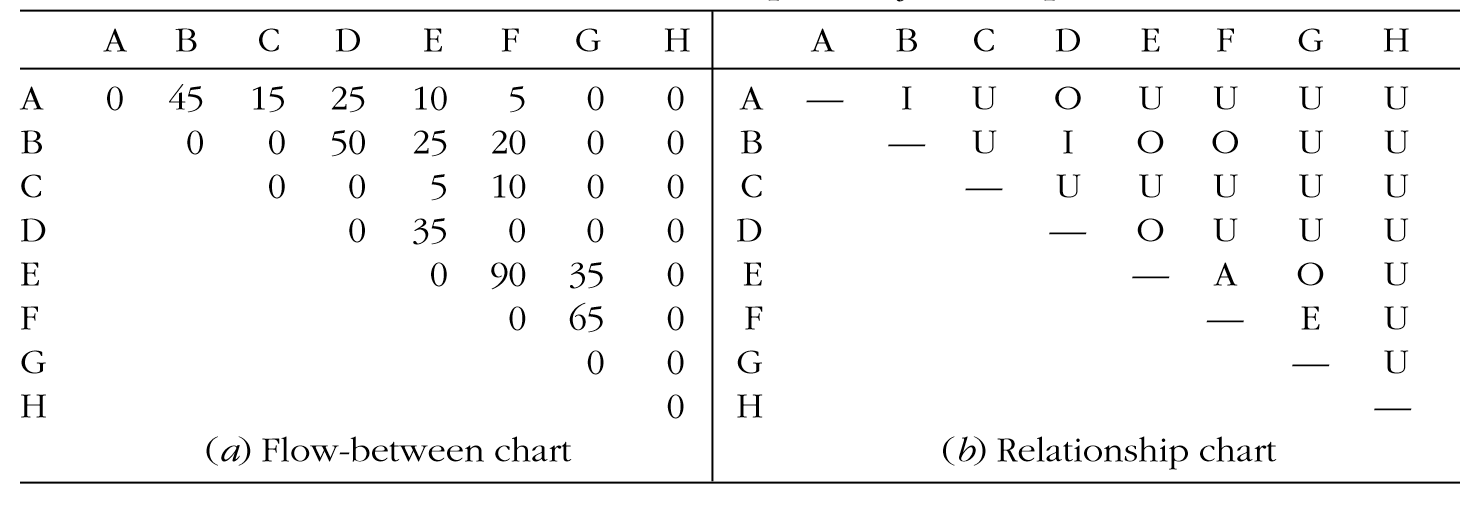
Figure 16: Flows \(f_{ij}\) and \(f_{ji}\) are added to create a symmetric flow-between chart. Then, the maximum value of the flow-between chart (i.e., 90) is divided into five 18-units intervals (viz., A=73–90, E=55–72, I=37–54, O=19–36, U=0–18). (Tompkins 2010)

Flows to closeness rating

The closeness ratings can be used instead of flows \(f_{ij}\):

  • Assign a numerical value to each closeness rating of departments \(i\) and \(j\).
    • For example, A=10, E=5, I=2, O=1,  U=0, and X=-10.
    • Using a non-zero value for U and a non-negative value for X is more appropriate for some algorithms (avoid if possible!).
      • Alternative assignment example: A=6, E=5, I=4, O=3, U=2, and X=1.
  • Caution in determining the values:
    • Adjacent departments with an U relationship should not affect the score.
    • Adjacent departments with an X relationship should adversely affect the score.

Material flow planning

U-shaped, straight-through, modular-spine, and multi-story flow paths work in isolation or in conjunction with one another to form the large majority of warehouse flow paths.

(a) U-shaped flow
(b) I-shaped flow
(c) L-shaped flow
Figure 17: Examples of warehouse flow paths (source: BigRentz)

U-Shaped flow

  • High utilization of dock resources (receiving and shipping can share dock doors).
  • Easier cross-docking (adjacent receiving and shipping docks).
  • High lift-truck utilization:
    • put-away and retrieval trips are easily combined.
    • fast-moving items closest to the receiving and shipping docks.
  • Expansion opportunities in three directions.
  • Higher security (entry and exit at the single side of the building).
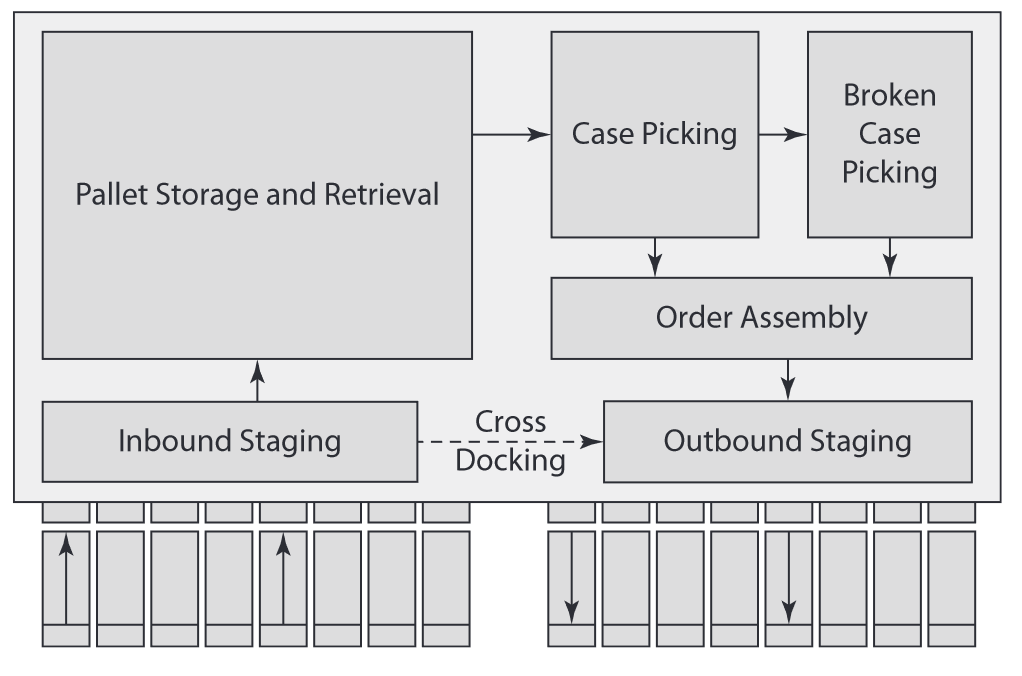
Figure 18: Products flow in at receiving and move to receiving staging, pallet storage, case picking, broken-case picking, order assembly, and shipping (Frazelle 2016)

Straight-through I-shaped flow design

Favors operations where the warehouse

  • is attached to factories (receipts arriving from production lines).
  • is a cross-docking/flow-through facility.
  • has coinciding peak receiving and shipping times.

Disadvantages:

  • Hard to implement ABC storage and dual-command1 trips.
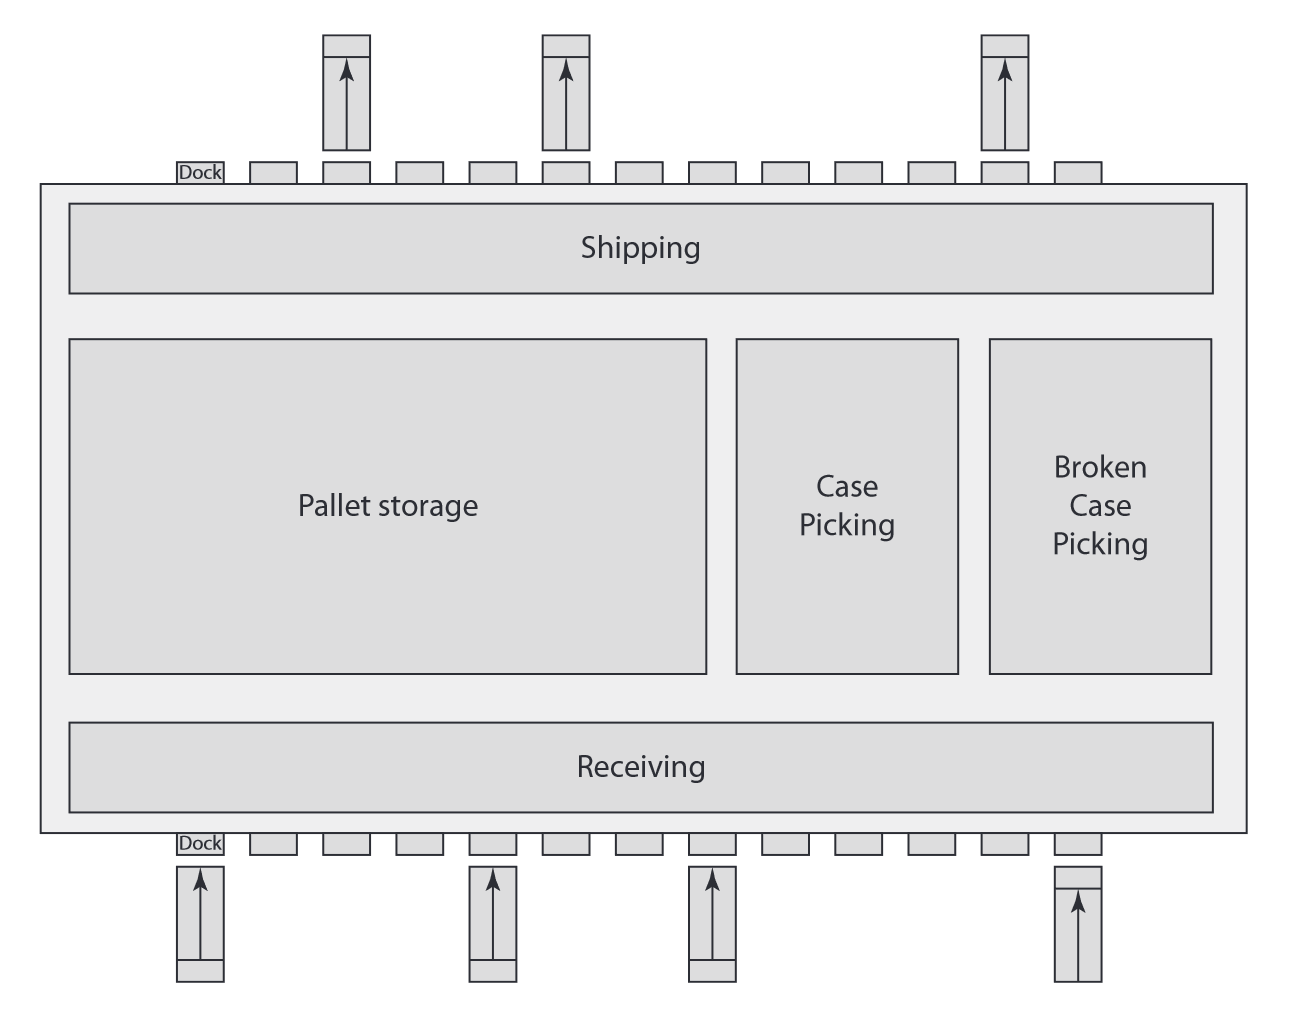
Figure 19: Straight-through flow design (Frazelle 2016)

Modular-spine flow design

Uses a large material-handling spine to connect independent buildings.

  • Standalone buildings are dedicated to specific warehouse activities in large-scale warehousing and distribution environments. Examples:

    • rack-supported buildings for a unit-load automated storage and retrieval system (ASRS);
    • air-conditioned building for customizing operations such as monogramming, pricing, and marking;
    • building dedicated to returns processing;
    • shipping building equipped with high-speed sorting equipment.
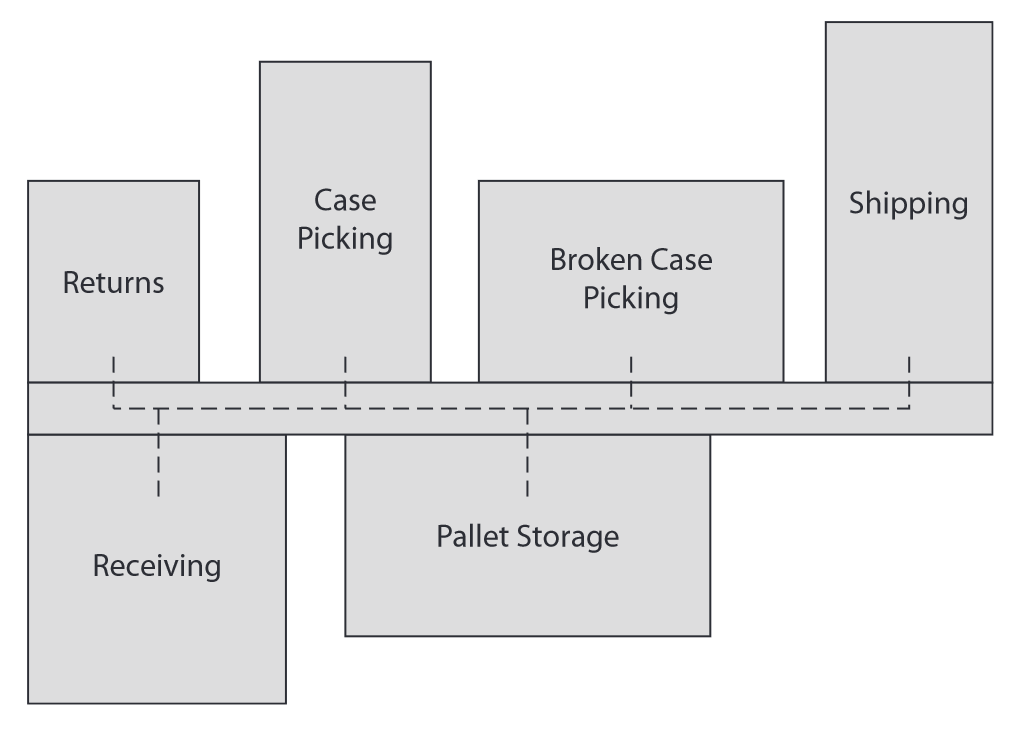
Figure 20: Modular-spine flow design (Frazelle 2016)

References

Aussaresse, S. 2023. “Warehousing Trends and Innovations: Best Practices.” BSc thesis, University of Twente, Industrial Engineering; Management. https://purl.utwente.nl/essays/96629.
Baker, Peter, and Marco Canessa. 2009. “Warehouse Design: A Structured Approach.” European Journal of Operational Research 193 (2): 425–36. https://doi.org/10.1016/j.ejor.2007.11.045.
Frazelle, Edward. 2016. World-Class Warehousing and Material Handling. Second Edition. McGraw-Hill Education.
Muther, Richard, and Lee Hales. 2015. Systematic Layout Planning. 4th ed. Management & Industrial Research Publications. https://richardmuther.com/wp-content/uploads/2016/07/Systematic-Layout-Planning-SLP-4th-edition-soft-copy.pdf.
Richard Muther. 2005. Overview of Systematic Layout Planning (SLP). https://richardmuther.com/wp-content/uploads/2014/06/RMA-1146-SLP-Overview-Mfg.pdf.
Richards, Gwynne. 2014. Warehouse Management: A Complete Guide to Improving Efficiency and Minimizing Costs in the Modern Warehouse. Second edition. Kogan Page Limited.
Rouwenhorst, Bart, Bert Reuter, Volker Stockrahm, Geert-Jan van Houtum, Rob Mantel, and Willem H. M. Zijm. 2000. “Warehouse Design and Control: Framework and Literature Review.” European Journal of Operational Research 122 (3): 515–33. https://doi.org/10.1016/S0377-2217(99)00020-X.
The Raymond Corporation. 2018. Storage Space Efficiency Guide: A Demonstration in Space. Brochure. The Raymond Corporation. https://www.raymondcorp.com/forklifts/orderpickers/-/media/0f1598ebec4e43feb77f9a5d1a074898.ashx.
Tompkins, James A., ed. 2010. Facilities Planning. 4th ed. J. Wiley.