Warehouse storage optimization: Inventory management
Inventory is money sitting around in a different form. Rhonda Abrams
🧠 Learning objectives
- Understand the fundamental differences among approaches to managing inventory.
- Describe the rationale and logic behind the economic order quantity (EOQ) approach to inventory decision making.
- Determine a product EOQ under conditions of certainty and uncertainty.
What is inventory?
- Stock or store of goods:
- Raw materials, work-in-progress (WIP), finished goods.
- Maintenance, repair, and operating (MRO) supplies.
Why keep inventory?
- To meet customer demand (cycle stock)
- To buffer against uncertainty in demand or supply (safety stock)
- To allow economic purchase orders (lot size inventory)
- To allow flexibility in production scheduling (anticipation inventory)
- To hedge against price increases or shortages (speculative inventory)
- To decouple supply from demand (pipeline inventory)
Warehouse management vs. inventory management
- Warehouse management
- Focus: Efficient warehouse operations (storage and movement of goods).
- Key decisions (related to inventory): Where to store and how to handle items.
- Goal: Maximize warehouse efficiency and ensure timely order fulfillment.
- Inventory management
- Focus: Balancing inventory levels to meet customer demand while minimizing costs.
- Key decisions: When and how much inventory to order.
- Goal: Maintain optimal inventory levels to avoid stockouts and overstocking.
Tip
Warehouse management can inform inventory management decisions by identifying fast-, medium-, slow-, non-moving, and obsolete stock (Richards 2014; “Warehouse Vs. Inventory” 2025).
Inventory management
How to keep the right amount of inventory on hand?
- Too much inventory: wasting capital (excess inventory and holding costs).
- Too little inventory: stockouts (lost sales, unhappy customers).
Key differences between inventory management approaches
- Dependent Demand vs. Independent Demand
- Pull versus Push
- System-wide versus Single-facility
Major inventory management approaches:
- Just-in-time (JIT)
- Materials Requirements Planning (MRP)
- Distribution Requirements Planning (DRP)
- Vendor-managed Inventory (VMI)
- Economic Order Quantity (EOQ)
Dependent vs. independent demand
Independent
- Unrelated to the demand for other items.
- Demand for end-use items sold to a customer does not depend on a higher-order manufactured item.
- Inventory policy depends on demand forecasting.
Dependent
- Demand directly related to, or derives from, the demand for another inventory item or product
- Raw materials, component parts, sub-assemblies depend on the demand for the finished product (e.g., computer chip).
- Inventory policy depends on demand forecasting for the higher-order manufactured item.
Pull vs. push
Pull approach
- Relies on customer orders to move product through the logistics system
- Can respond quickly to sudden demand changes
- Little or no finished goods inventory
- Postponement of value addition
- Run on short-term forecasts (flexibility to adapt to demand swings)
- Examples: JIT, EOQ
Push approach
- Inventory replenishment techniques in anticipation of demand (proactive)
- Limited ability to adapt to changing demand volumes and preferences
- Longer-term forecasts
- Scale economies in manufacturing
- High finished goods inventories (impacted by shelf life)
- Examples: VMI
EOQ-based systems in evidence today are hybrid approaches that include elements of both pull- and push-based strategies.
System-wide vs. single-facility solutions
- System-wide approach. Plan inventory releases and receipts between multiple shipping and receiving points in the logistics system. Example:
- MRP (Materials Requirements Planning)
- DRP (Distribution Requirements Planning)
- VMI (Vendor-Managed Inventory)
Single-facility approach. Release orders from a single facility (e.g., DC) to a specific supplier for inventory replenishment. Example:
- EOQ (Economic Order Quantity)
- JIT (Just-In-Time)
- VMI (Vendor-Managed Inventory)
Inventory policy decisions
Decisions to set an inventory policy:
- How much to order?
- Order enough to cover demand for a certain period (e.g., one week, one month).
- Order a fixed amount each time (e.g., EOQ).
- When to order?
- Order periodically, on a set schedule (often more convenient for suppliers).
- Order when inventory levels drop below a certain level (triggering orders).
Fixed order quantity approach (condition of certainty)
- Involves ordering a fixed amount of product each time reordering takes place.
- Exact amount of product to be ordered depends on
- the product’s cost and demand characteristics
- relevant inventory carrying and reordering costs
What is Economic Order Quantity (EOQ)?
- Mathematical approach to calculating lot size proposed first by Harris (1913; see historical context in Erlenkotter 1990).
- Balances the cost of placing an order against the cost of holding inventory.
- Formula requires tweaking in the real-world:
- Packaging (e.g., you need X items, but pallet is sold with X+Y)
- Seasonal demand
- Promotions
- Quantity discounts
- Variable lead times
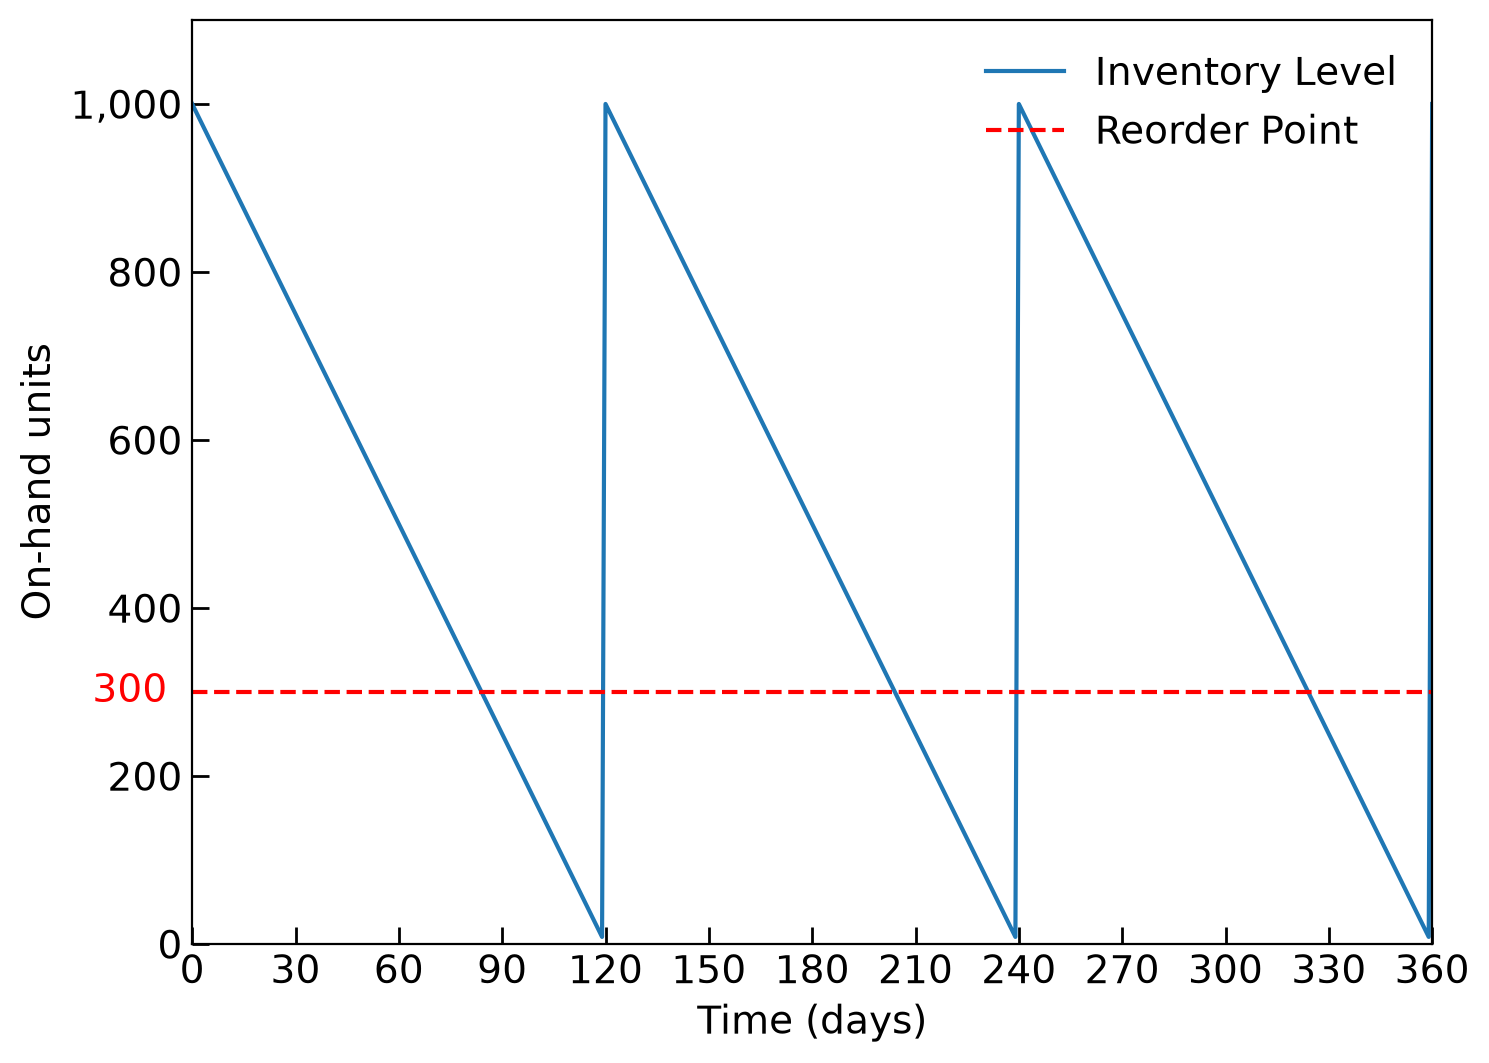
Reorder point
- Minimum stock level to determine when to reorder the fixed order quantity (the EOQ).
- Triggers the next order.
- Quantity depends on:
- Time to get the new order
- Demand for the item within lead time
- Example:
- Lead time new order = 10 days;
- Demand = 10 units/day;
- Reorder point = 100 units (10 \(\times\) 10).
Inventory cycles
Simple EOQ Model Assumptions (Pt. 1)
- A continuous, constant, and known rate of demand
- A constant and known replenishment or lead time
- No concerns about stockouts or safety stocks
- All demand is satisfied
- A constant price or cost that is independent of the order quantity (i.e., no quantity discounts)
- No inventory in transit
- Organization purchases goods on a delivered price basis (purchase price includes transportation costs).
Simple EOQ Model Assumptions (Pt. 2)
- One item of inventory or no interaction between items; multiple items compound mathematical complexity.
- Infinite planning horizon: constraints are not imposed on the length of the time periods included in the basic model.
- Unlimited capital: no financial reasons limit the quantity ordered.
EOQ Formulation
| Symbol | Description |
|---|---|
| \(R\) | Annual rate of demand (units) |
| \(Q\) | Quantity ordered (units) |
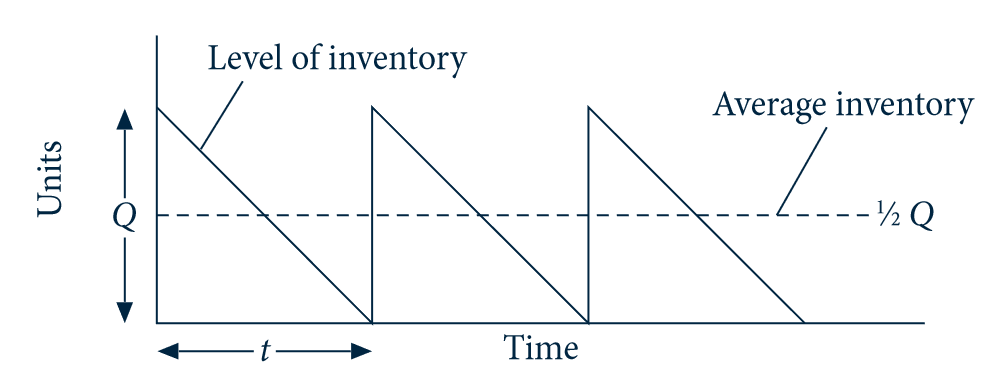
| \(\frac{1}{2}Q\) | Avg. number of units during order cycle |
| \(A\) | Cost of placing an order |
| \(V\) | Cost of one unit of inventory |
| \(W\) | Carrying cost/unit of inventory/year (%) |
| \(S\) | = \(VW\). Inventory carrying cost per unit per year |
| \(t\) | Order cycle time (days) |
| \(TAC\) | Total annual cost |
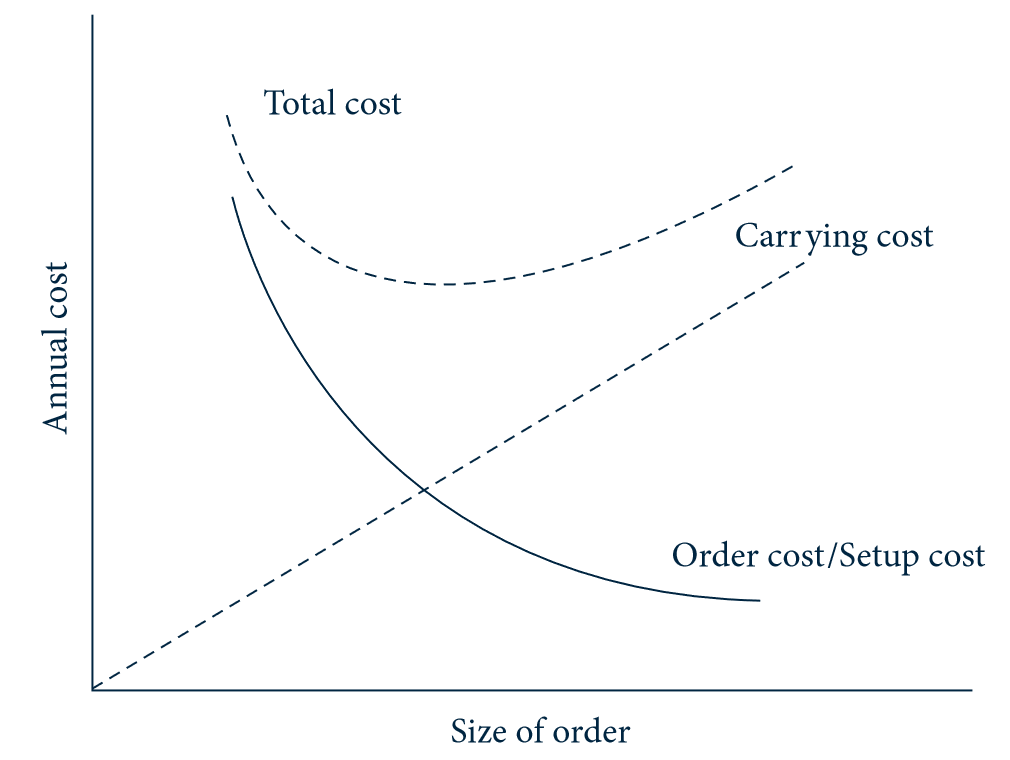
Total annual cost (TAC) equation
The total annual cost (TAC) is:
\[ TAC = \overbrace{\frac{1}{2}QVW}^{\substack{\text{Carrying}\\\text{costs}}} + \overbrace{A\frac{R}{Q}}^{\substack{\text{Ordering}\\\text{costs}}} \]
Where:
- \(Q\) = order quantity (units)
- \(R\) = annual rate of demand (units)
- \(V\) = cost of one unit of inventory
- \(W\) = carrying cost/unit of inventory/year (%)
- \(A\) = cost of placing an order
EOQ graphical representation
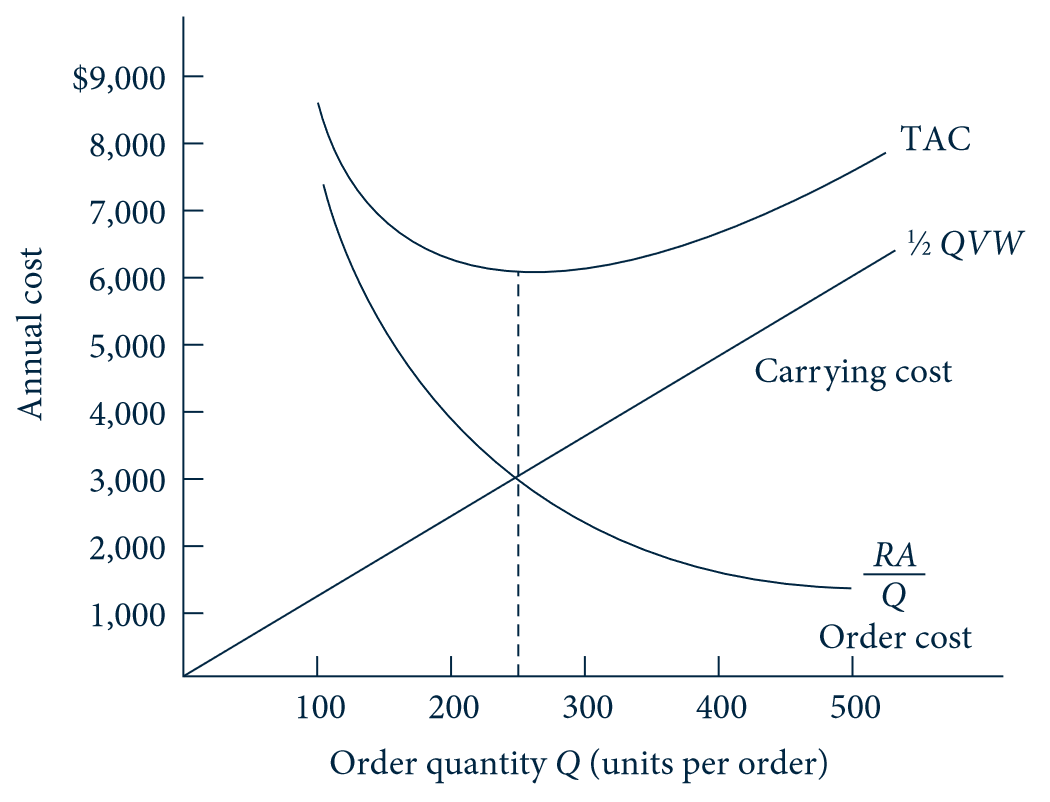
EOQ variables and total annual cost
| Symbol | Description |
|---|---|
| \(R\) | Annual rate of demand (units) |
| \(Q\) | Quantity ordered (units) |
| \(\frac{1}{2}Q\) | Avg. number of units during order cycle |
| \(A\) | Cost of placing an order |
| \(V\) | Cost of one unit of inventory |
| \(W\) | Carrying cost/unit of inventory/year (%) |
| \(S\) | = \(VW\). Inventory carrying cost per unit per year |
| \(t\) | Order cycle time (days) |
| \(TAC\) | Total annual cost |
The total annual cost balances inventory carrying and ordering costs:
\[ TAC = \overbrace{\frac{1}{2}QVW}^{\substack{\text{Carrying}\\\text{costs}}} + \overbrace{A\frac{R}{Q}}^{\substack{\text{Ordering}\\\text{costs}}} \]
Deriving the optimal EOQ
To find the optimal \(Q\):
- Differentiate the \(TAC\) function: \[ \frac{\partial(TAC)}{\partial Q} = \frac{VW}{2} - \frac{AR}{Q^2 } \]
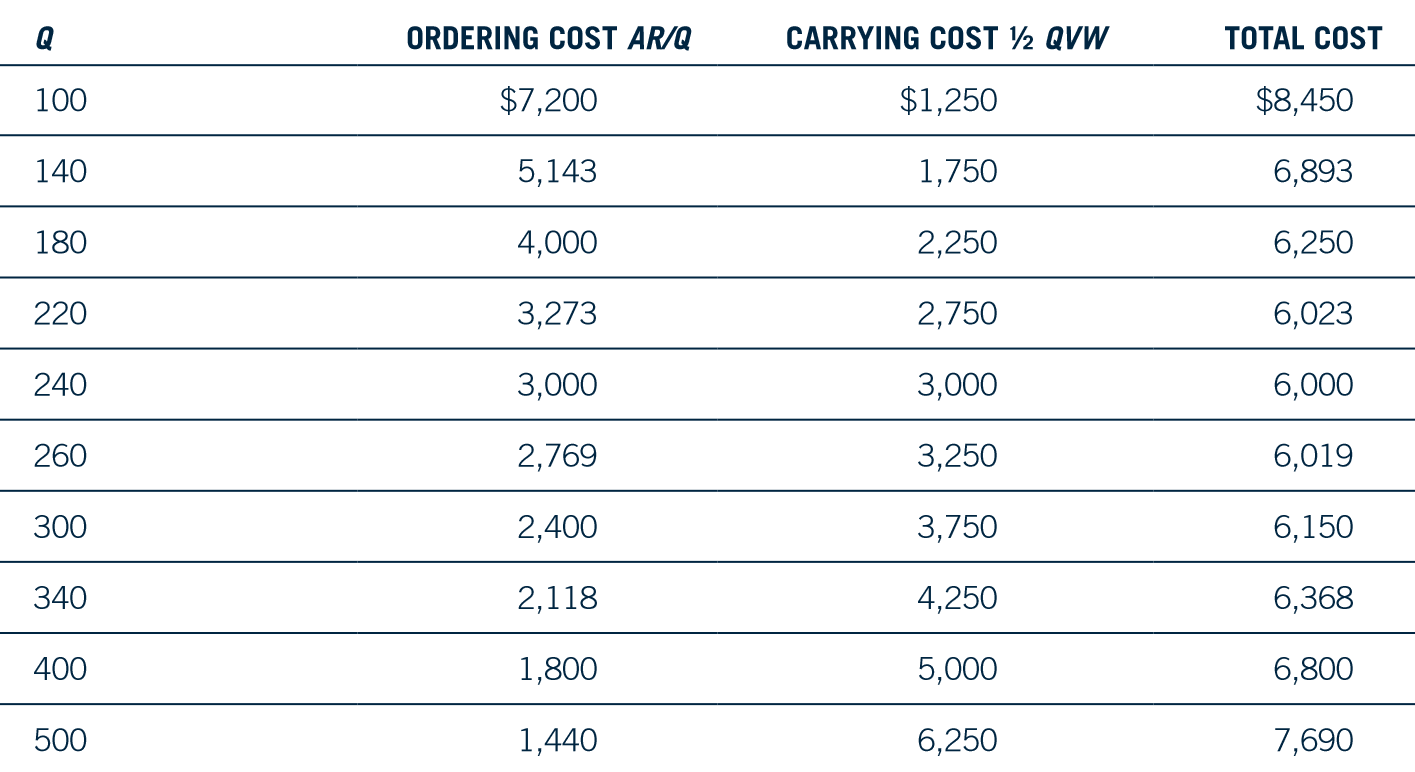
- Set \(\frac{\partial(TAC)}{\partial Q}=0\) and solve for \(Q\): \[ \begin{align} Q^2 & = \frac{2AR}{VW} \\ Q & = \sqrt{\frac{2AR}{VW}} = \sqrt{\frac{2AR}{S}} \end{align} \]
Example
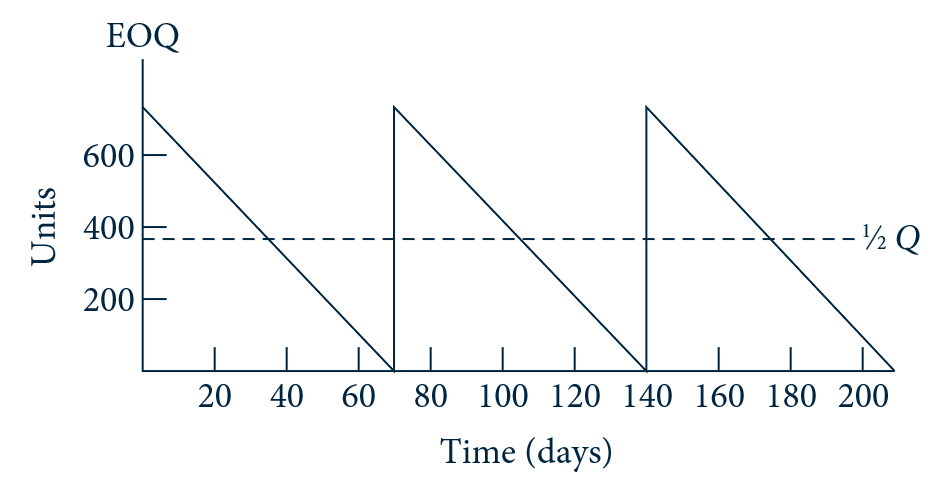
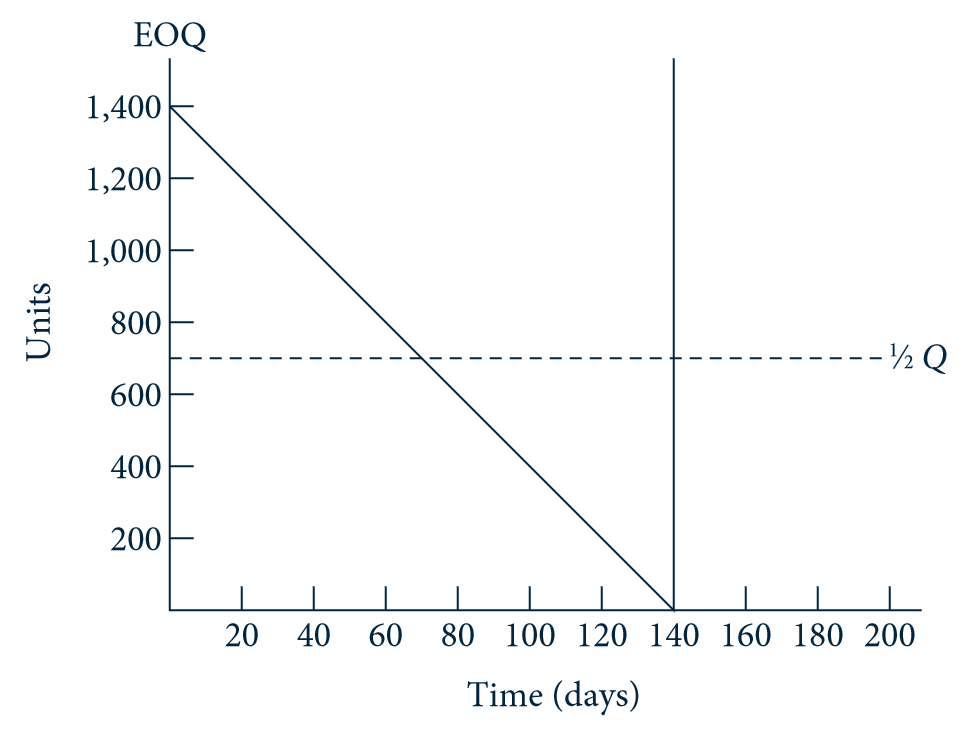
EOQ example
Reorder point (the “when”)
Under the assumptions of certainty, an organization needs only enough inventory to last during the replenishment time or lead time.
Replenishment time consists of:
- order transmittal (electronic, manual)
- order processing (inventory availability)
- order preparation
- order delivery (transportation mode)
Given a lead time, we have:
\[ \text{Reorder point} = \text{Lead time} \times \text{daily demand} \]
Example:
- \(\text{Lead time}\) = 1 day (transmittal) + 2 days (processing & preparation) + 5 days (delivery) = 8 days.
- \(\text{Daily demand}\) = 10 units/day (3,600 units/360 days).
- \(\text{Reorder point}\) = 8 days × 10 units/day = 80 units.
Summary
- Useful to illustrate the logic of inventory management.
- Not the fastest way to respond to customer demand.
- Can be adjusted to handle more complex situations.
- Organizations adapt EOQ-based approaches to include push/pull orientation.
- Push (proactive inventory management) approaches are more prevalent in organizations having greater logistics sophistication.
- Suits inventory decision-making at a single facility.
- Not robust to simultaneous demand peaks (e.g., many customers stocking up on groceries).
Warehouse storage optimization: Reorder point under uncertainty
01
Fixed order quantity approach (condition of uncertainty)
Most organizations do not operate under conditions of certainty:
- Demand rates depend on many factors, such as:
- weather and sporadic social or physical needs;
- day, week, and season.
- Lead times depend on (long-distance) transit times.
- Transit times:
- Affected by many factors, such as: weather, highway congestion, port congestion, border stops.
- Order transmittal and processing (e.g., credit blocks, inventory unavailability).
- Transit times:
Adjusting inventory models to account for uncertainty
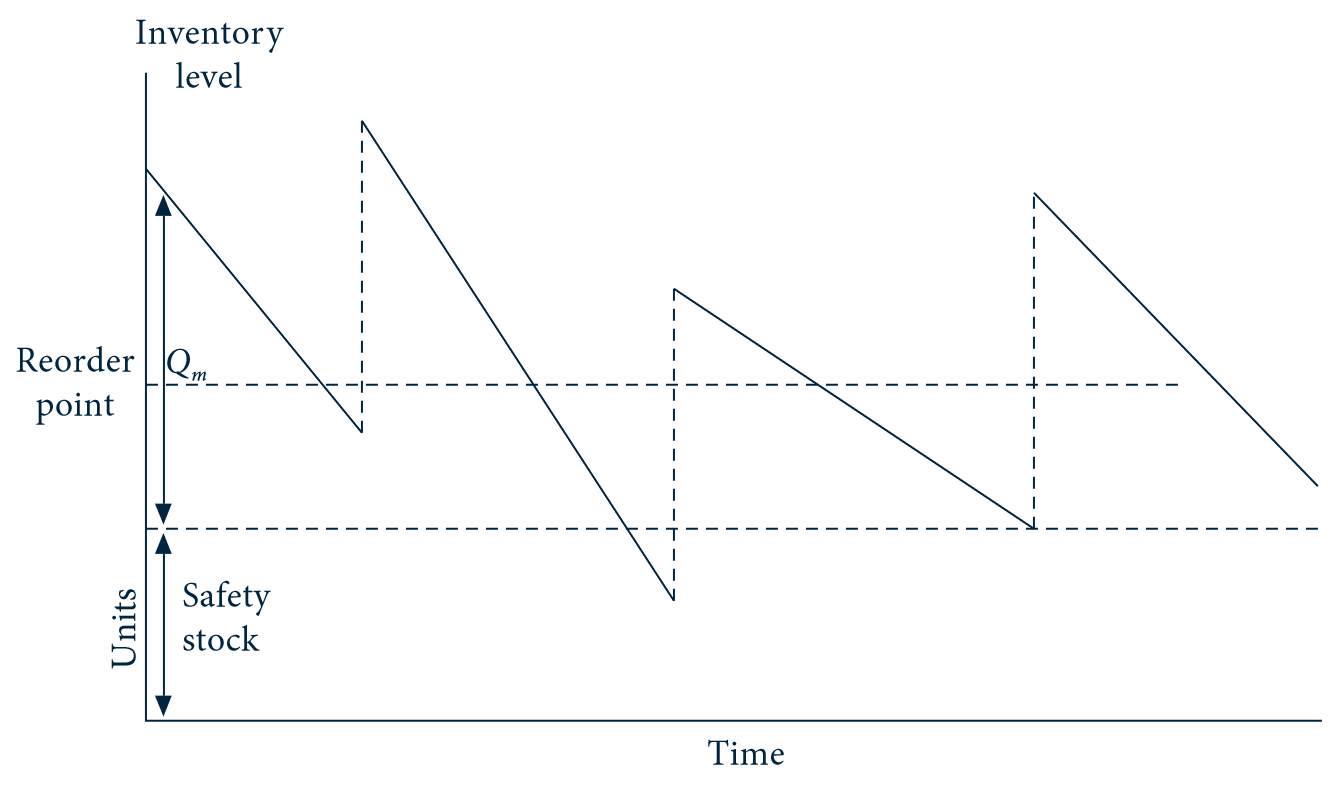
- Demand
- Not known or constant.
- Result: on-hand inventory line fluctuates
- above the EOQ amount;
- below zero units.
- Lead time (or cycle)
- Not known or constant.
- Result: varying period length.
- Safety stock
- Amount depends on
- demand/lead time variability;
- customer service requirements.
- Amount depends on
Safety stock
- A tradeoff exists between the cost of holding safety stock versus the cost of a stockout.
- Many techniques exist for setting safety stock levels (see King 2011).
- As service level requirements increase, safety stocks increase at an increasing rate.
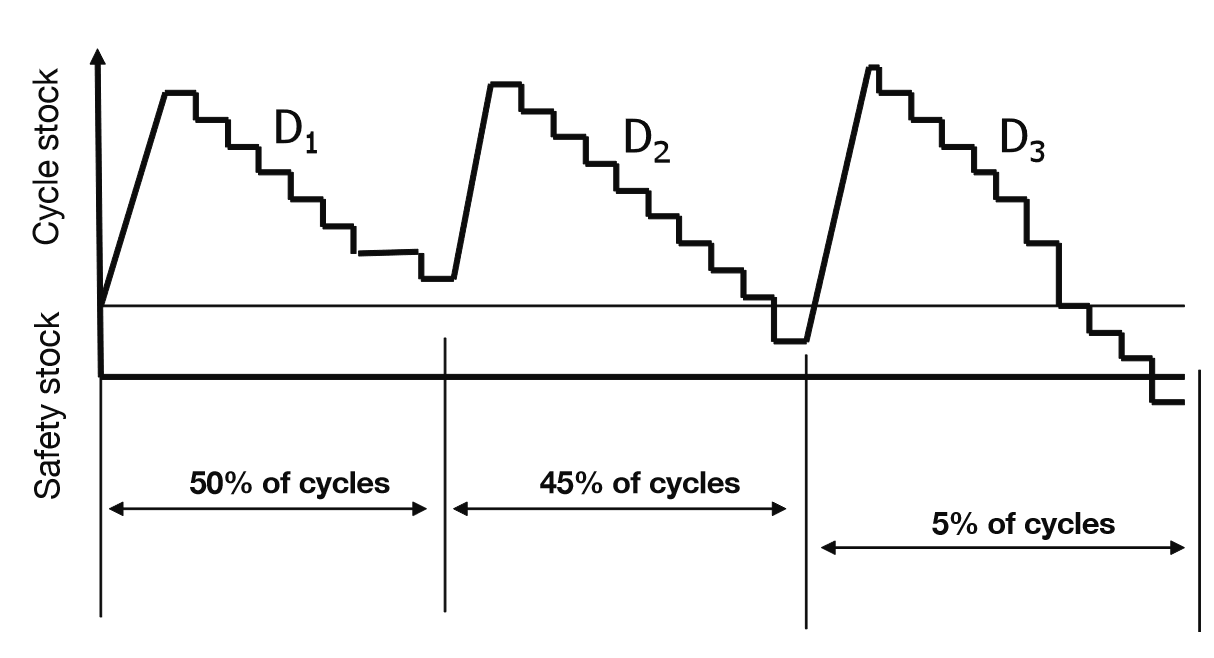
Figure 6: Inventory designed for a 95% service level (King 2011)
Adjusting the reorder point
EOQ model with certainty
The reorder point is the on-hand inventory level needed to satisfy demand during lead time.
EOQ model under uncertainty
The reorder point is the average daily demand during lead time plus the safety stock.
Uncertainty of demand
How much product customers will demand during a constant/known lead time when usage rate is varying?
The reorder level must balance:
- Cost of carrying safety stock
- Stockout (lost sales) costs
If the reorder level is:
- Too high = too much stock on hand when the next order arrives.
- Too low = stockout leading to lost sales.
Example: Lowest cost reorder point calculation
Different reorder points are considered for possible demands within the lead time:
Input: Expected demand prob. distribution
| Demand (units) |
Prob. |
|---|---|
| 100 | 0.01 |
| 110 | 0.06 |
| 120 | 0.24 |
| 130 | 0.38 |
| 140 | 0.24 |
| 150 | 0.06 |
| 160 | 0.01 |
Step 1: Inventory shortage or excess
Possible units of inventory in shortage or excess:
| Actual demand |
100 | 110 | 120 | 130 | 140 | 150 | 160 |
|---|---|---|---|---|---|---|---|
| 100 | 0 | 10 | 20 | 30 | 40 | 50 | 60 |
| 110 | -10 | 0 | 10 | 20 | 30 | 40 | 50 |
| 120 | -20 | -10 | 0 | 10 | 20 | 30 | 40 |
| 130 | -30 | -20 | -10 | 0 | 10 | 20 | 30 |
| 140 | -40 | -30 | -20 | -10 | 0 | 10 | 20 |
| 150 | -50 | -40 | -30 | -20 | -10 | 0 | 10 |
| 160 | -60 | -50 | -40 | -30 | -20 | -10 | 0 |
Step 2: Expected short or excess units
Expected number of units in short or in excess:
| Actual demand | Prob. | 100 | 110 | 120 | 130 | 140 | 150 | 160 |
|---|---|---|---|---|---|---|---|---|
| 100 | 0.01 | 0.0 | 0.1 | 0.2 | 0.3 | 0.4 | 0.5 | 0.6 |
| 110 | 0.06 | -0.6 | 0.0 | 0.6 | 1.2 | 1.8 | 2.4 | 3 |
| 120 | 0.24 | -4.8 | -2.4 | 0.0 | 2.4 | 4.8 | 7.2 | 9.6 |
| 130 | 0.38 | -11.4 | -7.6 | -3.8 | 0.0 | 3.8 | 7.6 | 11.4 |
| 140 | 0.24 | -9.6 | -7.2 | -4.8 | -2.4 | 0.0 | 2.4 | 4.8 |
| 150 | 0.06 | -3.0 | -2.4 | -1.8 | -1.2 | -0.6 | 0.0 | 0.6 |
| 160 | 0.01 | -0.6 | -0.5 | -0.4 | -0.3 | -0.2 | -0.1 | 0.0 |
Inputs for annual cost evaluation
Input: EOQ variables
- Annual demand (\(R\)) = 3,600 units/year
- Demand within lead time = 100–160 units
- EOQ (\(Q\)) = 240 units (estimated before)
- Stockout cost (\(k\)) = $10
- Carrying cost/unit/year (\(W\)) = 25%
- Cost of one unit of inventory (\(V\)) = $100
- Carrying cost/year (\(VW\)) = $25
- Avg. demand = 130
Step 3: Lowest-cost reorder point
The lowest-cost reorder point minimizes annual stockout and carrying costs:
| Calculation of lowest cost reorder point | 100 | 110 | 120 | 130 | 140 | 150 | 160 |
|---|---|---|---|---|---|---|---|
| 1. Expected excess/cycle (\(e\)) | 0 | 0.1 | 0.8 | 3.9 | 10.8 | 20.1 | 30 |
| 2. Expected carrying cost/year (\(eVW\)) | $0 | $2.50 | $20.00 | $97.50 | $270 | $502.50 | $750 |
| 3. Expected shorts/cycle (\(g\)) | 30 | 20.1 | 10.8 | 3.9 | 0.8 | 0.1 | 0 |
| 4. Expected stockout cost/cycle (\(gk\)) = \(G\) | $300 | $201 | $108 | $39 | $8 | $1 | $0 |
| 5. Expected stockout cost/year (\(G\frac{R}{Q}\)) | $4,500 | $3,015 | $1,620 | $585 | $120 | $15 | $0 |
| 6. Expected total cost/year (2. + 5.) | $4,500 | $3,017.50 | $1,640 | $682.50 | $390 | $517.50 | $750 |
Optimal EOQ notation
| Symbol | Description |
|---|---|
| \(R\) | Annual rate of demand (units) |
| \(Q\) | Quantity ordered (units) |
| \(\frac{1}{2}Q\) | Avg. number of units during order cycle |
| \(A\) | Cost of placing an order |
| \(V\) | Cost of one unit of inventory |
| \(W\) | Carrying cost/unit of inventory/year (%) |
| \(e\) | Expected excess in units |
| \(g\) | Expected shorts in units |
| \(k\) | Stockout cost in dollars per unit stocked out |
| \(G=gk\) | Expected stockout cost per cycle |
| \(G\frac{R}{Q}\) | Expected stockout cost per year |
| \(eVW\) | Expected carrying cost per year for excess inventory |
Optimal EOQ mathematical formulation
To find the optimal \(Q\):
Calculate the total annual cost: \[ \begin{align} TAC = \overbrace{\frac{1}{2}QVW}^{\substack{\text{Carrying}\\\text{costs}}} + \overbrace{A\frac{R}{Q}}^{\substack{\text{Ordering}\\\text{costs}}} + \overbrace{(eVW)}^{\substack{\text{Safety}\\\text{cost}}} + \overbrace{\left(G\frac{R}{Q}\right)}^{\substack{\text{Stockout}\\\text{cost}}} \end{align} \]
Differentiate the \(TAC\) function: \[ \begin{align} \frac{\partial(TAC)}{\partial Q} = \frac{1}{2}VW - \frac{R(A+G)}{Q^2} \end{align} \]
Set \(\frac{\partial(TAC)}{\partial Q}=0\) and solve for \(Q\): \[ \begin{align} Q & = \sqrt{\frac{2R(A+G)}{VW}} \end{align} \]
Example: EOQ inputs
| Symbol | Description | Value |
|---|---|---|
| \(R\) | Annual rate of demand (units) | 3,600 |
| \(A\) | Cost of placing an order | $200 |
| \(V\) | Cost of one unit of inventory | $100 |
| \(W\) | Carrying cost/unit of inventory/year (%) | 25% |
| \(e\) | Expected excess in units | 10.8 |
| \(g\) | Expected shorts in units | 0.8 |
| \(k\) | Stockout cost in dollars per unit stocked out | $10 |
| \(G=gk\) | Expected stockout cost per cycle | $8 |
Example: EOQ order quantity
New value of \(Q\) considering reorder point = 140:
\[ \begin{align} Q & = \sqrt{\frac{2R(A+G)}{VW}}\\ & = \sqrt{\frac{2\times3,600\times(200+8)}{\$100\times 25\%}}\\ & = 245\; \text{units (approximately)} \end{align} \]
Example: EOQ annual cost calculation
The annual total combines carrying, ordering, safety-stock, and stockout costs:
\[ \begin{align} TAC =\;& \frac{1}{2}QVW + A\frac{R}{Q} + eVW + G\frac{R}{Q} \\ =\;& \left(\frac{1}{2} \times 245 \times \$100 \times 25\% \right) + \left(200\times\frac{3,600}{245}\right)\\ & + \left(10.8\times\$100\times25\%\right) + \left(8\times\frac{3,600}{245}\right)\\ =&\; \$3,062.50 + \$2,938.78 + \$270 + \$117.55\\ =&\; \$6,389\\ \end{align} \]
Uncertainty of demand and lead time length
Example:
| Symbol | Description | Value |
|---|---|---|
| \(R\) | Average replenishment cycle (days) | 8 |
| \(\sigma_{R}\) | Standard deviation of replenishment cycle (days) | 2 |
| \(S\) | Average daily demand (units) | 20 |
| \(\sigma_{S}\) | Standard deviation of daily demand (units) | 4 |
| \(\bar{X}\) | = \(SR\). Average demand during lead time (units) | 160 |
| \(\sigma\) | = \(\sqrt{R(\sigma_{S})^2 + (S\sigma_{R})^2}\)1 Standard deviation of demand during lead time (units) | ~42 |
| Reorder point | Probability of no stockout occurring | Probability of a stockout situation |
|---|---|---|
| \(\bar{X} + 1\sigma = 202\) | 84.13% | 15.87% |
| \(\bar{X} + 2\sigma = 244\) | 97.72% | 2.28% |
| \(\bar{X} + 3\sigma = 286\) | 99.87% | 0.13% |
Under uncertainty, increasing the reorder point has the same effect as increasing the safety stock commitment.
Fixed order interval approach
- Also called fixed period or fixed review period approach.
- Combines elements of both the pull and push philosophies:
- Involves ordering inventory at fixed or regular intervals.
- Amount ordered depends on on-hand inventory level at review time.
- In comparison with the basic EOQ approach:
- Does not require close surveillance
- Less expensive monitoring
- Count inventory near the interval’s end
- Best used for items having relatively stable demand.
- Does not require close surveillance
Fixed order interval example
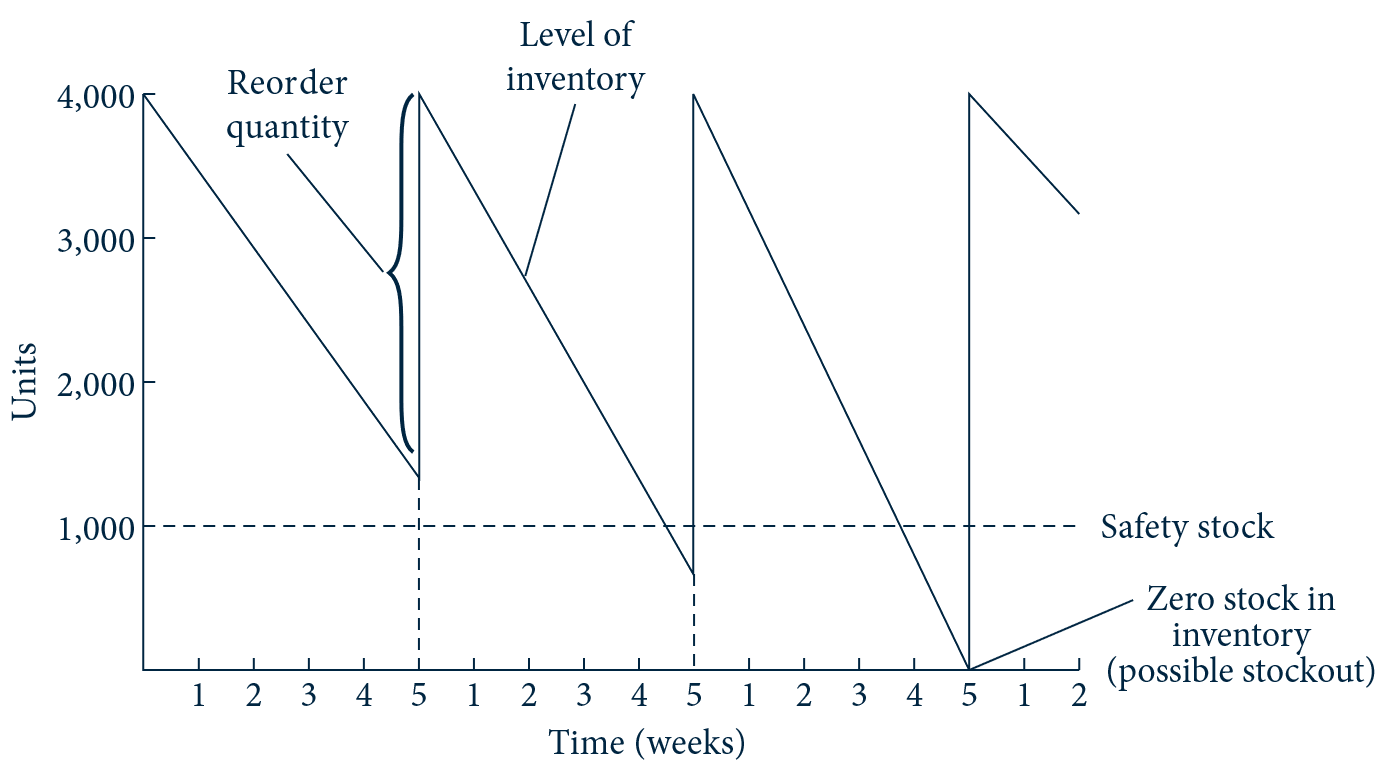
Figure 7: An organization selling 2,500 units before its next order will have to reorder 2,500 units plus the units it anticipates selling during the lead time. The amount ordered differs from one five-week period to the next (Coyle et al. 2020)
Optimizing inventory ordering policies in practice
How to optimize the inventory policies of thousands of SKUs?
Automatically, with warehouse management systems (WMSs).
References
Coyle, John Joseph, C. John Langley, Robert A. Novack, and Brian J. Gibson. 2020. Supply Chain Management: A Logistics Perspective. 11th edition. Cengage.
Erlenkotter, Donald. 1990. “Ford Whitman Harris and the Economic Order Quantity Model.” Operations Research 38 (6): 937–46.
Gitman, Lawrence J., Carl McDaniel, Amit Shah, et al. 2018. “Introduction to Business.” OpenStax, September 19. https://openstax.org/books/introduction-business/pages/10-4-pulling-it-together-resource-planning.
Harris, Ford Whitman. 1913. “How Many Parts to Make at Once.” Factory, The Magazine of Management.
King, Peter L. 2011. “Understanding Safety Stock and Mastering Its Equations.” APICS Magazine. https://web.mit.edu/2.810/www/files/readings/King_SafetyStock.pdf.
Lisan, Sharfuddin. 2018. “Safety Stock Determination of Uncertain Demand and Mutually Dependent Variables.” International Journal of Business and Social Research.
Richards, Gwynne. 2014. Warehouse Management: A Complete Guide to Improving Efficiency and Minimizing Costs in the Modern Warehouse. Second edition. Kogan Page Limited.
Stanton, Daniel. 2023. Supply Chain Management for Dummies. 3rd ed. John Wiley & Sons, Inc.
“Warehouse Vs. Inventory: Their Roles And Differences.” 2025. Inbound Logistics, February 3. https://www.inboundlogistics.com/articles/warehouse-vs-inventory/.
Warehousing - M-IEM - Breno A. Beirigo